Join Our Telegram channel to stay up to date on breaking news coverage
Bitcoin Price Prediction – February 27
The Bitcoin price prediction shows that BTC is falling below the moving averages as it trades around the $38,248 level.
BTC/USD Long-term Trend: Bearish (Daily Chart)
Key levels:
Resistance Levels: $44,000, $46,000, $48,000
Support Levels: $34,000, $32,000, $30,000
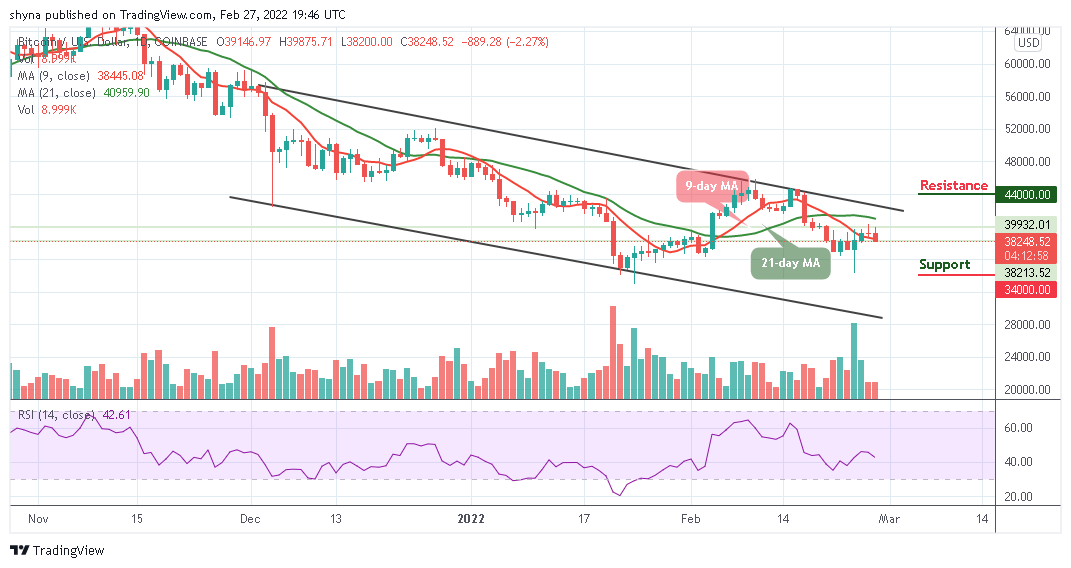
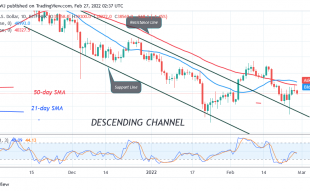
The daily chart reveals that BTC/USD begins to move downward within the descending channel with the current consolidation pattern. However, the coin fails to close above the $39,875 level as it may likely see a sharp drop towards the lower boundary of the channel. Meanwhile, the first support level may be located at $35,000. Beneath this, other supports lie at $34,000, $32,000, and $30,000.
Bitcoin Price Prediction: Would Bitcoin (BTC) Break Above $40k?
As the daily chart reveals, the Bitcoin price could not break above the resistance level at $39,875, the coin may set up another few days of negative price declines beneath $38,000. A break above the previous level would have set Bitcoin up to retest the $40,000 level, but the technical indicator Relative Strength Index (14) may cross below 40-level to add more bearish movements.
At the time of writing, traders can see that the Bitcoin price breaks below the 9-day moving average to gain more downtrends. More so, the Bitcoin price touches $39,875 but now dropping beneath the support level of $38,500. However, it does look that bears may end up closing below this support, but any movement towards the upside may hit resistance levels of $44,000, $46,000, and $48,000.
BTC/USD Medium-Term Trend: Bearish (4H Chart)
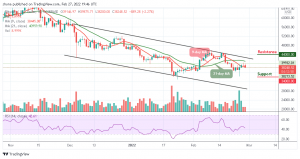
The 4-hour chart shows that the Bitcoin bears are now stepping back into the market pushing the BTC price below its previous support level that existed around $37,800. Although the Bitcoin price has not yet slipped below $37,500, it’s still in the loop of making a bounce back.
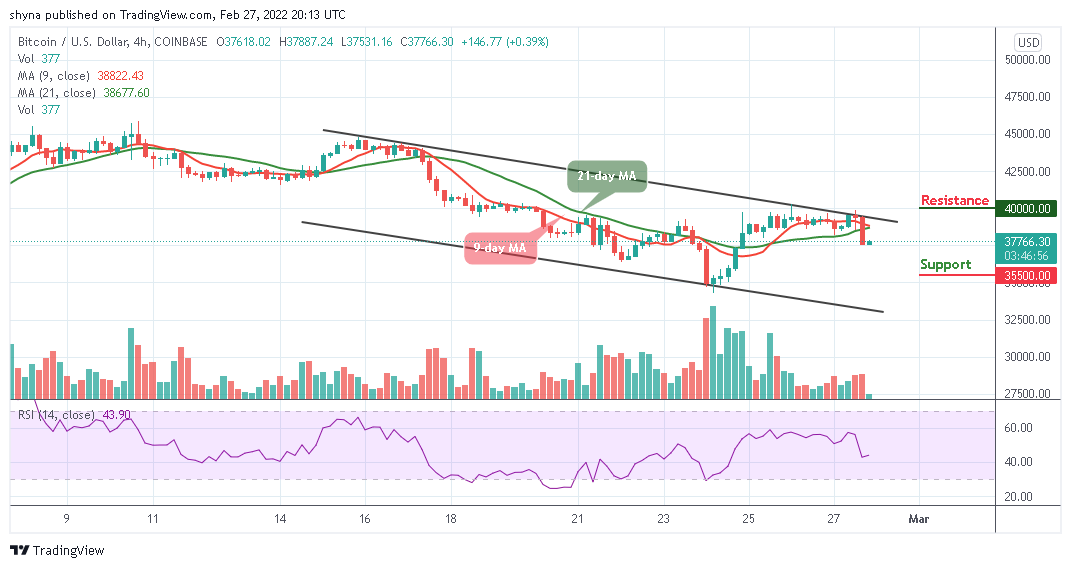
Now, BTC/USD is currently moving below the 9-day and 21-day moving averages. The upward movement may likely push the price nearest resistance at $40,000 and above while the immediate support lies at $35,500 and below. The technical indicator Relative Strength Index (14) is moving above 40-level, which indicates that the market may move sideways.
Looking to buy or trade Bitcoin (BTC) now? Invest at eToro!
68% of retail investor accounts lose money when trading CFDs with this provider
Read more:
- How to buy Bitcoin
- How to buy Cryptocurrency
Join Our Telegram channel to stay up to date on breaking news coverage