Join Our Telegram channel to stay up to date on breaking news coverage
The Bitcoin price rose over 1% in the past 24 hours to trade at $66,652.81 as of 8:15 a.m. EST as investors slowly start to accumulate the largest crypto by market cap.
BTC’s lackluster 24-hour performance does not tell the full story, however, as a major bullish technical event is on the cusp of taking place.
BTC and the rest of the crypto market might be close to entering the next highly-anticipated bull market as BTC’s 200-day Simple Moving Average (SMA) tries to rise to new heights.
The Bitcoin Price Has The Support Of A Long-Term Technical Indicator

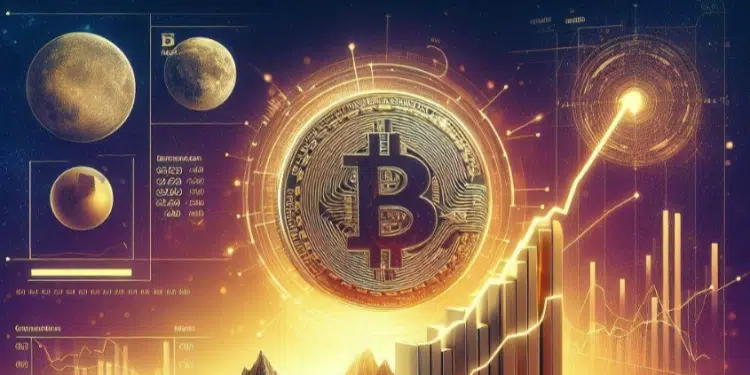
Daily chart for BTC/USDT (Source: TradingView)
The 200 SMA on BTC’s daily chart is approaching the peak that it set on Feb. 24, 2022. Back then, the technical indicator reached a high of $49,452.
After rising above this technical barrier in October 2023, BTC soared to unprecedented heights. Now, the Bitcoin price has the support of this key long-term technical indicator. This could provide BTC with a strong foundation to rise off of in the coming weeks.
What’s more, BTC’s 200-day SMA is currently hovering around $48,088.79, and could still climb given its positive slope. Should it keep rising, BTC’s price will likely follow suit.
The SMA breaking above its previous peak might then be identified as a sign that Bitcoin, along with the rest of the crypto market, has entered a bullish cycle. This is due to the fact that historical data shows the most intense phase of past bullish cycles happened when the BTC’s 200-day SMA soared to a new all-time high.
BTC Enters A Fresh Short-Term Positive Trend
From a short-term perspective, the Moving Average Convergence Divergence (MACD) recently triggered a major bullish technical flag on the daily chart. This was after the MACD line crossed above the MACD Signal line in the past 48 hours.
Traders tend to see this specific technical occurrence as an indication that a crypto has entered into a bullish phase. Since this took place on the daily chart, it suggests that the Bitcoin price has entered into a short to medium-term positive trend.
If this trend continues, both the Bitcoin price and the 200-day SMA could keep climbing in the coming couple of days. From a price perspective, BTC might look to flip the $69,085.36 resistance into support before potentially soaring to as high as $74,005.
Meanwhile, the 200-day SMA could rise as well if the bullish thesis plays out, and possibly attempt to overcome its previous peak.
However, a rejection from the $69,085.36 barrier in the next few days might invalidate this bullish thesis. In this alternative scenario, the market leader might retest the immediate support at $65,104.05, before possibly falling to $60,714.87 if the sell pressure persists.
With the recent cross between the MACD and MACD Signal line, it seems that a bullish scenario is more likely to play out.
Bitcoin derivative presales such as 99Bitcoins (99BTC) could stand to benefit from any increase in BTC’s price. Not only is 99BTC a smaller-capped altcoin with higher growth potential than BTC, its branding’s link to Bitcoin means that a surge in interest for the market leader could steer people to 99BTC.
An Innovative Approach To Crypto Education
99Bitcoins is a crypto education platform that has become one of the best online learning resources in the Web3 space.
With over 709k followers across its social accounts and 2 million registered users on its platform, 99Bitcoins has successfully broken down complex crypto terms for many over the years.
To expand its offering, the 99Bitcoins team has decided to launch their own crypto token, 99BTC. Users on the platform will subsequently be able to complete interactive courses and tutorials in exchange for crypto rewards.
By completing courses on the platform, users will also gain access to additional educational content. This means that more opportunities to earn rewards paid in 99BTC will be unlocked the more users engage with the 99Bitcoins platform.
Investors Rush To Get In On 99BTC’s High Staking Rewards
More than $750k has been sent to 99BTC’s presale as the ICO charges towards the $1 million milestone. A potential reason for this investor frenzy around 99Bitcoins could be the extremely high APY being offered to anyone who buys and stakes 99BTC at this early stage.
Confused by The Halving? Let us explain!
Every 4 years, the reward for Bitcoin mining is halved. The new reward is now 3.125 #BTC!
It's a built-in feature to make #Bitcoin scarcer over time, continuing until all 21 million are mined.
Learn more: ⬇️ https://t.co/w36bsKBoOa
— 99Bitcoins (@99BitcoinsHQ) April 23, 2024
With an eye-watering 2,466% APY available through the project’s staking program, investors are flocking to the token’s presale to get in on this amazing opportunity before it’s too late.
To start earning through this staking program, investors just need to navigate to the project’s website and buy 99BTC, which is selling for $0.00102. USDT, BNB, ETH or bank card can be used to acquire the token. The final step to start earning is to then stake the tokens.
99BTC can be purchased and staked on its official website here.
Related Articles:
- Mt. Gox’s $9 Billion Bitcoin Repayment May “Spook” Markets, Pressure Bitcoin, K33 Says
- 5 Best Meme Coins to Buy After the Bitcoin Halving – Crypto Gems with High Upside Potential
- Upcoming Crypto Presales: Unlock Early Investment Opportunities!
Join Our Telegram channel to stay up to date on breaking news coverage