Join Our Telegram channel to stay up to date on breaking news coverage
Bitcoin Price Prediction – January 25
After a slight recovery, the Bitcoin price prediction shows that BTC moves above the resistance level of $36,500 to aim at the 9-day moving average.
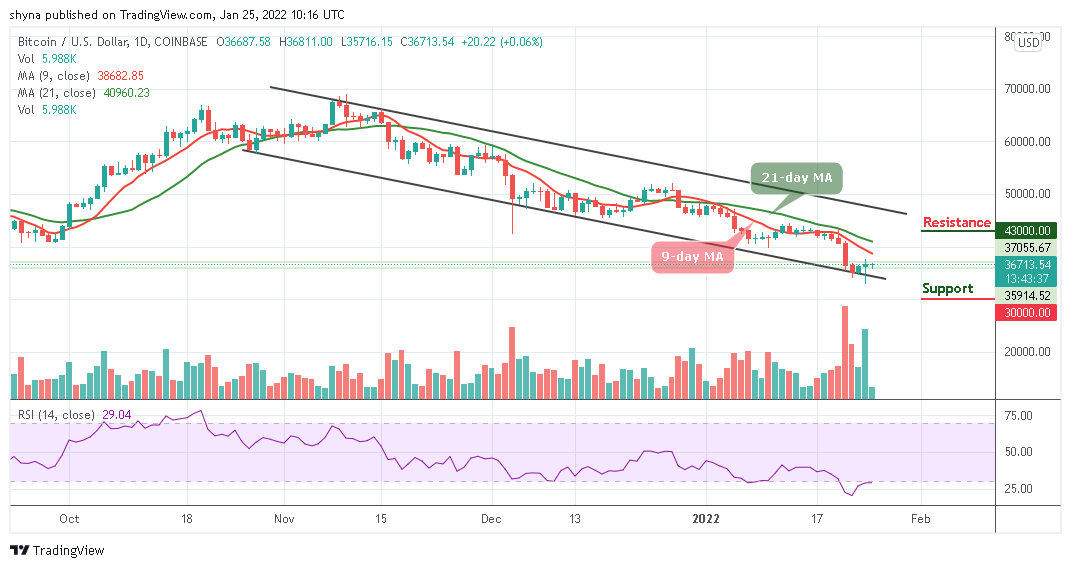
BTC/USD Long-term Trend: Bearish (Daily Chart)
Key levels:
Resistance Levels: $43,000, $45,000, $47,000
Support Levels: $30,000, $28,000, $26,000
Looking to buy or trade Bitcoin (BTC) now? Invest at eToro!
68% of retail investor accounts lose money when trading CFDs with this provider
BTC/USD is resuming a bullish movement after a brief recovery yesterday bringing the price from the low of $32,933 to trade at $36,713. A couple of days ago, BTC/USD was seen crossing below the lower boundary of the channel as revealed by the technical indicator. However, the price of the first digital asset is trying to move towards the north by trading above the resistance level of $36,000.
Bitcoin Price Prediction: Is Bitcoin (BTC) Ready for the Upside?
The Bitcoin price is now moving towards the 9-day and 21-day moving averages which could function as the support zones in the event a reversal occurs. On the upside, as the coin moves and prepares a movement towards the moving averages, little is in place to prevent correction targeting the key resistance of $38,000 as the technical indicator Relative Strength Index (14) is trying to move out of the oversold region.
However, the king coin is banking on the support at $35,000 to ensure that in spite of a reversal, the Bitcoin price stays above the $36,500 level. Similarly, the nearest resistance levels are located at $43,000, $45,000, and $47,000 while the support levels to keep an eye on are 30,000, $28,000, and $26,000 respectively.
BTC/USD Medium – Term Trend: Bearish (4H Chart)
The 4-hour chart shows that the price is hovering above the 9-day and 21-day moving averages as the technical indicator Relative Strength Index (14) is likely to cross above 60-level to confirm the uptrend. Although the 9-day MA is trying to cross above the 21-day MA to begin a bullish movement, the market may likely experience more of this if the price spike towards the upper boundary of the channel.
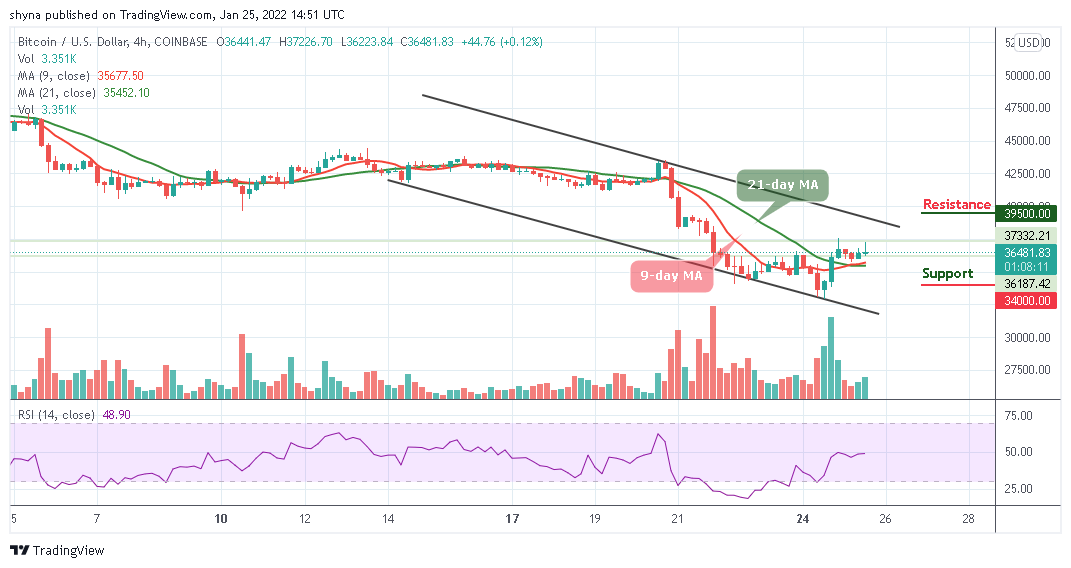
Meanwhile, the support level of $34,000 and below may come into play if the price breaks below the moving averages. But if the buyers keep the Bitcoin price at the upside; crossing above the upper boundary of the channel could hit the targeted resistance level of $39,500 and above.
Looking to buy or trade Bitcoin (BTC) now? Invest at eToro!
68% of retail investor accounts lose money when trading CFDs with this provider
Read more:
- How to buy Bitcoin
- How to buy Cryptocurrency
Join Our Telegram channel to stay up to date on breaking news coverage