Join Our Telegram channel to stay up to date on breaking news coverage
Bitcoin Price Prediction – March 15
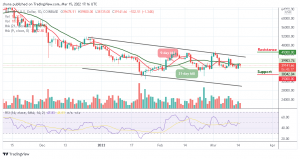
Following the $39,500 break, the Bitcoin price prediction shows BTC dropping slightly after getting rejected at $39,800.
BTC/USD Long-term Trend: Bearish (Daily Chart)
Key levels:
Resistance Levels: $45,000, $47,000, $49,000
Support Levels: $35,000, $33,000, $31,000
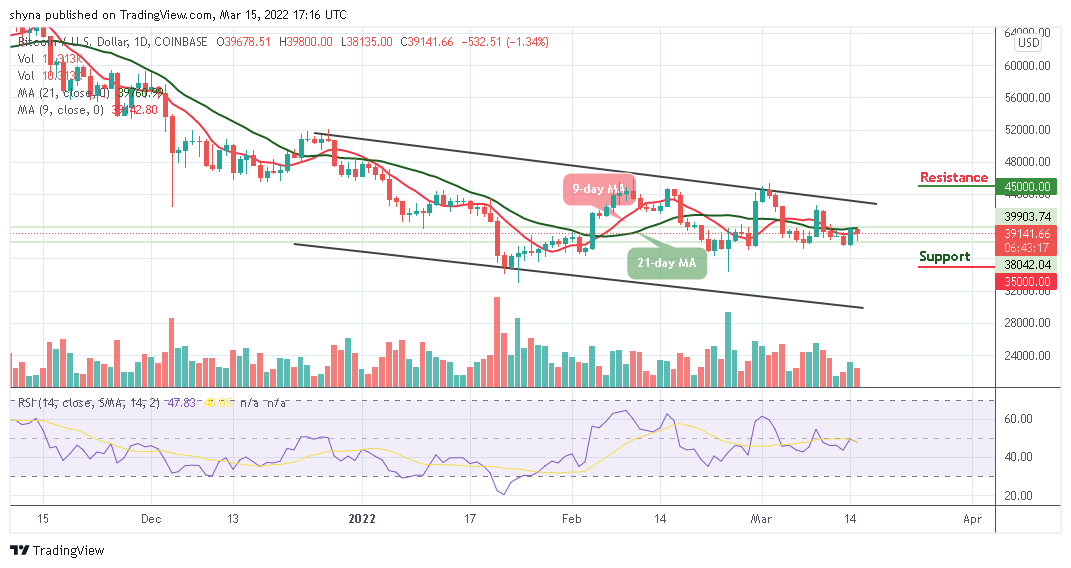
BTC/USD is now showing slight negative signals after touching the daily high of $39,800 today. The Bitcoin price fails to make any ground towards the upper boundary of the channel. Therefore, the coin is dropping with a loss of 1.34% within the channel as it touches the daily low of $38,135.
Bitcoin Price Prediction: Bitcoin Price May Consolidate Around $39k
The daily chart reveals that the Bitcoin price may continue to develop some signs of weakness if the king coin breaks below the 9-day and 21-day moving averages. However, the resistance provided during the European session continues to fail each time it attempts to break, and close above the channel. Meanwhile, the market price remains bearish as the signal line of the Relative Strength Index (14) moves below 50-level.
In the meantime, the Bitcoin price needs to break the $40,000 resistance to make the market bullish. But, if the sellers push the market price beneath the support at $38,000, the next level of support could lie at $36,000. Wherefore, beneath this, additional supports could be found at $35,000, $33,000, and $31,000 respectively.
On the contrary, should in case the bulls regroup and push higher, the Bitcoin price may hit the potential resistance levels at $45,000, $47,000, and $49,000.
BTC/USD Medium – Term Trend: Ranging (4H Chart)
Looking at the 4-hour chart, BTC/USD is ranging within the channel. During the European session today, the Bitcoin (BTC) touches the high of $39,400 before retreating to where it is currently changing hands at $39,212. Further bearish movement could locate the support level at $37,000 and below.
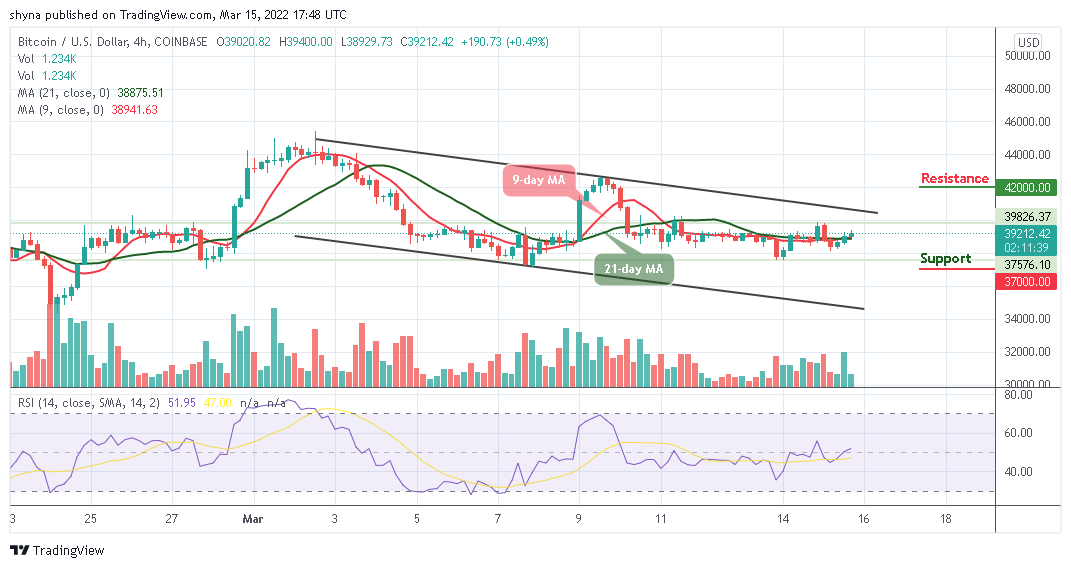
However, the technical indicator Relative Strength Index (14) is crossing above 50-level as the Bitcoin price rises above the 9-day and the 21-day moving averages. Any further bullish movements could push the market price to the potential resistance level of $42,000 and above.
Looking to buy or trade Bitcoin (BTC) now? Invest at eToro!
68% of retail investor accounts lose money when trading CFDs with this provider
Read more:
- How to buy Bitcoin
- How to buy Cryptocurrency
Join Our Telegram channel to stay up to date on breaking news coverage