Join Our Telegram channel to stay up to date on breaking news coverage
Bitcoin Price Prediction – May 27
The Bitcoin price is seen moving sideways around $39,319 and it may be vulnerable to a bigger correction.
BTC/USD Long-term Trend: Ranging (Daily Chart)
Key levels:
Resistance Levels: $48,000, $50,000, $52,000
Support Levels: $31,000, $29,000, $27,000
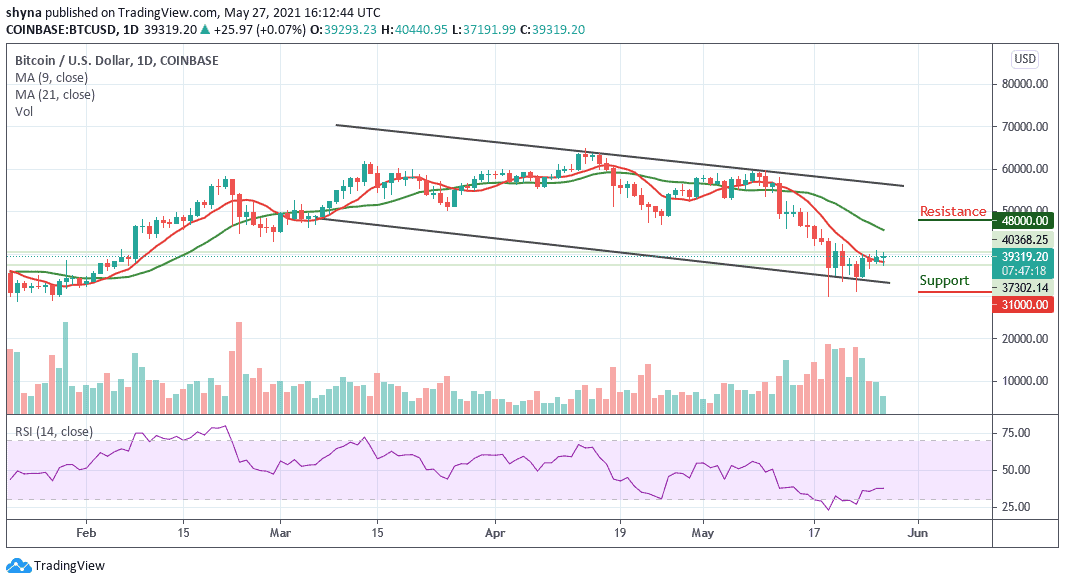
BTC/USD sees a sudden sell after yesterday’s gains as it dropped from a high of $40,440 to as low as $37,191. Though the Bitcoin price is attempting to bounce back as the recent drop is pushing the momentum within the bearish favor and this could be the start of a further retracement lower.
Bitcoin Price Prediction: What to Expect from Bitcoin (BTC)
Looking at the daily chart, we can see that Bitcoin rolled over from above the $40,000 resistance level as it started its descent lower. Therefore, it is about to drop beneath the 9-day moving average at $38,200 but manages to find support around the $37,191 which may allow it to bounce back higher.
However, if the sellers continue to drag the Bitcoin price back beneath the support at $35,000, the first level of lower support is located at $33,000. Beneath this, the critical support lies at $31,000, $29,000, and $27,000. On the other hand, if the bulls bounce above the 9-day and 21-day moving averages, they could reach the nearest resistance levels at $48,000, $50,000, and $52,000.
On the other hand, the technical indicator Relative Strength Index (14) is moving above 35-level which shows that the market may still follow an upward movement for a market recovery if the signal line crosses above 50-level.
BTC/USD Medium – Term Trend: Bearish (4H Chart)
On the 4-hour chart, BTC/USD has been trading within the range of $46,800 to $36,500 been revealed by the technical indicator Relative Strength Index (14). Nevertheless, the Bitcoin price has not yet slipped below $35,000 but still in the loop of making a bounce back. However, the Bitcoin price is changing hands at $39,286 and may take time to persistently trade above $42,000.
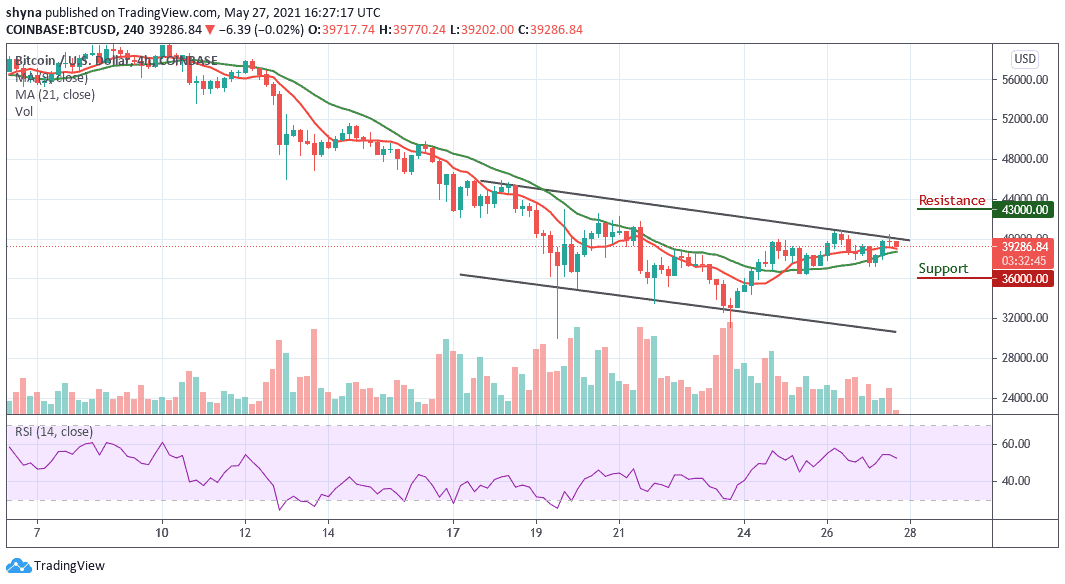
Moreover, according to the 4-hour chart, if the coin crosses above the upper boundary of the channel, the upward movement could be facing hurdles near the $43,000 and $45,000 resistance levels. Meanwhile, on the downside, immediate support is near the $38,500 level while the price might slide sharply below $37,000 which may likely test the main support at the $36,000 level and below.
Looking to buy or trade Bitcoin (BTC) now? Invest at eToro!
75% of retail investor accounts lose money when trading CFDs with this provider
Join Our Telegram channel to stay up to date on breaking news coverage