Join Our Telegram channel to stay up to date on breaking news coverage
Bitcoin Price Prediction – January 6
The Bitcoin price prediction shows that BTC indicates bearish momentum as further upside got rejected within the channel.
BTC/USD Long-term Trend: Bearish (Daily Chart)
Key levels:
Resistance Levels: $47,000, $49,000, $51,000
Support Levels: $39,000, $37,000, $35,000
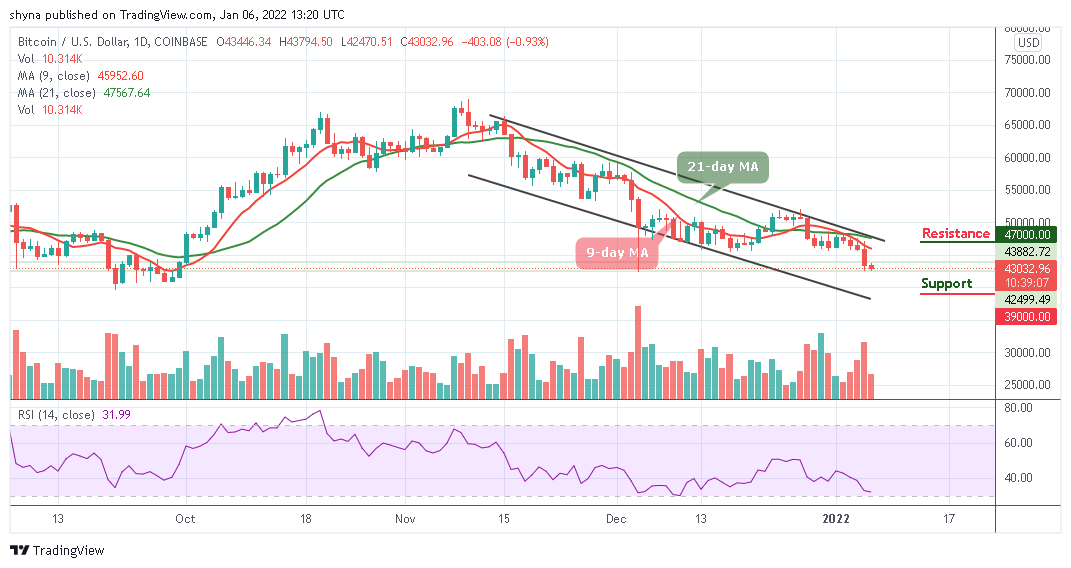
At the time of writing, BTC/USD is hovering at $43,032. A few hours ago, the Bitcoin price exchange hands below $43,000 in order to sustain the bearish price action. However, the current market movement is still downwards, and the daily chart shows that the formation of a bearish may continue to play.
Bitcoin Price Prediction: BTC May Stay at the Downside
Looking at the technical indicator, the Relative Strength Index (14) is moving into the oversold region; with the look of things, the Bitcoin price is likely to get move downwards as the red-line of the 9-day moving average crosses below the green-line of the 21-day moving average. This could mean that the king coin may stay at the downside in as much as it remains below the moving averages.
In other words, recovery may not come easy but a sustainable move above the upper boundary of the channel may locate the resistance level of $47,000, $49,000, and $51,000. However, an increase in selling pressure across the market could force the Bitcoin price to follow a painful path which could locate the supports at $39,000, $37,000, and $35,000 respectively.
BTC/USD Medium-Term Trend: Bearish (4H Chart)
Looking at the 4-hour chart, the Bitcoin price is currently moving below the 9-day and 21-day moving averages touching the low of $42,619 support. With the look of things, the Bitcoin price is not yet sure whether it could return to the bull market as the technical indicators remain within the negative side. On the other hand, if the price move towards the north, higher resistance could be located at $45,000 and above.
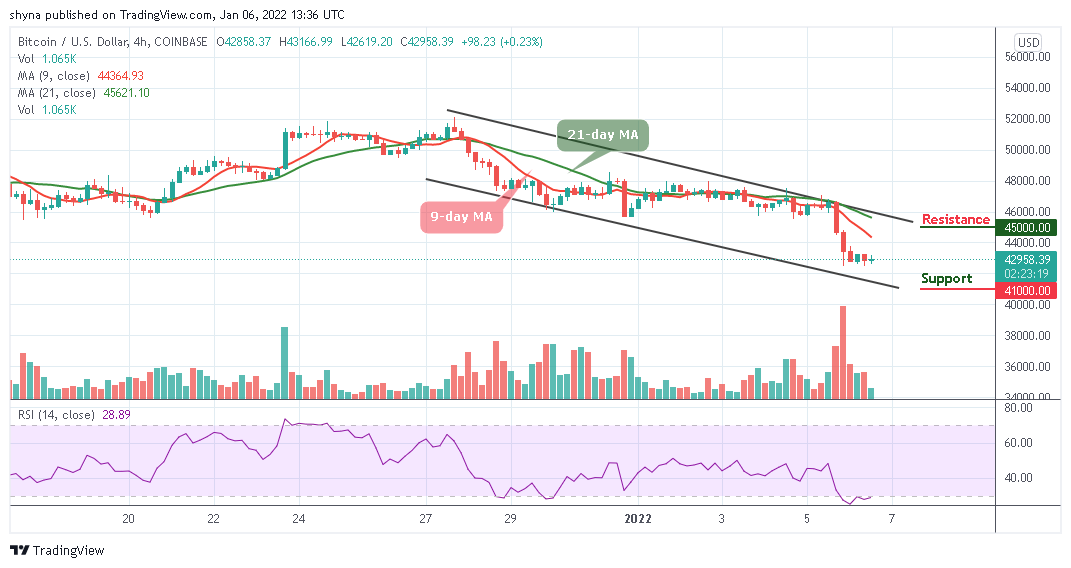
Now, as the technical indicator Relative Strength Index (14) within the oversold condition, the support level of $41,000 and below may come to play. More so, BTC/USD is likely to fall more if the price crosses below the lower boundary of the channel.
Looking to buy or trade Bitcoin (BTC) now? Invest at eToro!
68% of retail investor accounts lose money when trading CFDs with this provider
Read more:
- How to buy Bitcoin
- How to buy Cryptocurrency
Join Our Telegram channel to stay up to date on breaking news coverage