Join Our Telegram channel to stay up to date on breaking news coverage
Bitcoin Price Prediction – April 17
The market operations of BTC/USD are still kept in the confinement of $65,000 and $60,000 price levels over a couple of days’ sessions.
BTC/USD Market
Key Levels:
Resistance levels: $65,000, $70,000, $75,000,
Support levels: $55,000, $50,000, $45,000
BTC/USD – Daily Chart
The present BTC/USD trading situation is depicted as having the $60,000 level as the immediate key support line in the market. Meanwhile, the 14-day SMA trend-line and the bullish trend-line are closely located near below the immediate support line pointing towards the north. The 50-day SMA indicator keeps its posture below them to point also to the north. The Stochastic Oscillators have briefly crossed the hairs against range 80. They may probably soon cross back-upward to signify a return of bulls’ run in the crypto-economy.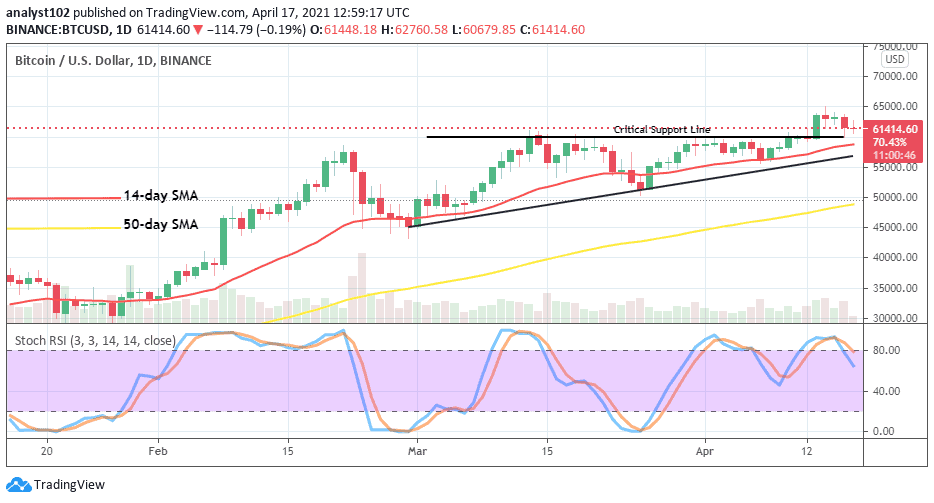
Will the BTC/USD market still see a hold within the levels of $65,000 and $60,000?
It is on a high note that the present trading position in the valuation of BTC/USD will still witness a continued less-impulsive price action around the major points of $65,000 and $60,000 as long as the two market movers remained inactive to create a volatile move. The present trading situation looks like having a kind of short-range-bound outlook. Therefore, it would technically correct to suggest a wait for more active price action before deciding the direction to go in this market.
The $65,000 immediate resistance trading line remains the start-line for the bears to continue to muster up energy especially while the price is been pushed down off from it now. However, a breakdown of the vital support line is also key in determining a return of market downturn. Nevertheless, indication has it that a quick price reverse may come to play around the level of $60,000.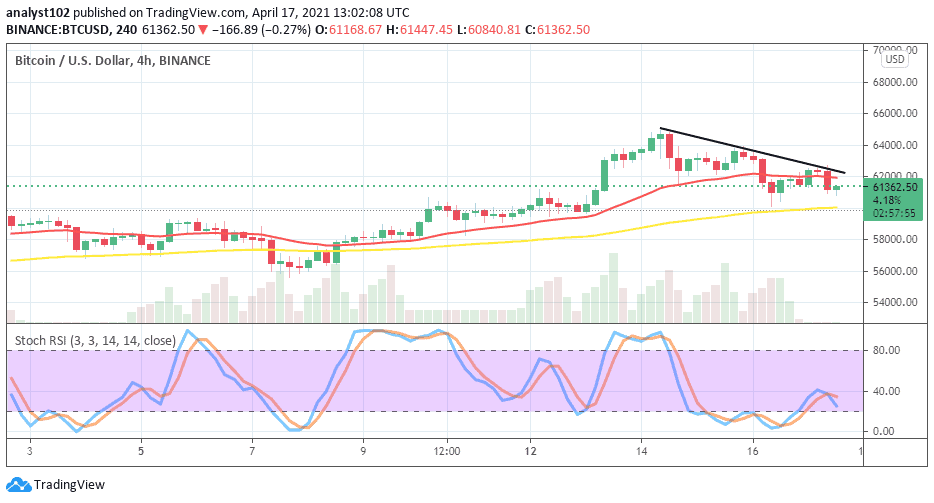
BTC/USD 4-hour Chart
In the medium-term, the trading chart depicts that the BTC/USD market is still under an upward price correctional move. The 50-day SMA trend-line has placed at the key level of $60,000 below the 14-day SMA trading indicator which has situated at $62,000. Price is hovering around the two points earlier mentioned. The Stochastic Oscillators are a bit crossed the hairs below range 40 to point towards the south. It shows that the correctional move isn’t over. Therefore, a chance to revisit a low point around the level of $60,000 is possible in the near time.
Join Our Telegram channel to stay up to date on breaking news coverage
