Join Our Telegram channel to stay up to date on breaking news coverage
Bitcoin Price Prediction – May 17
There has been an extension of price correction in the BTC/USD market valuation. The crypto’s worth now declines to trade around $45,140 with about a 2.80% decrease.
BTC/USD Market
Key Levels:
Resistance levels: $50,000, $55,000, $60,000,
Support levels: $40,000, $35,000, $30,000
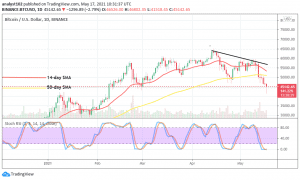
BTC/USD – Daily Chart
The BTC/USD daily chart has shown a new increase in the market’s downtrend as presently achieved in today’s session. It has to be recalled that the decrease begun majorly during the session on may 12. The bearish trend-line is located on top of the SMAs. The 50-day SMA indicator is underneath the 14-day SMA trend-line. And, they are all above the current market trading zone to indicate the extent at which price has fallen. The Stochastic Oscillators are dipped into the oversold region with closed hairs. That suggests the need to either suspend placing further sell position or to be on the lookout for a buy signal return of an uptrend.
Could the BTC/USD market fall further next?
It is currently indicated that a fall further in the BTC/USD market operations isn’t achievable in a near trading time as the Stochastic Oscillators are now in the oversold region to indicate a less-active move that can resurface in the market to bring about an upswing soon. Therefore, bulls are now expected to push against any falling pressure towards the support of $40,000.
On the downside, the resistance line at $50,000 would now have to be the point in determining the declining pressure at which bears have to keep against any probable bouncing-off the crypto may be making after a while. An interception of the bigger SMA indicator to the south by the small SMA may potentially lead to seeing more downs playing out below the level mentioned earlier on.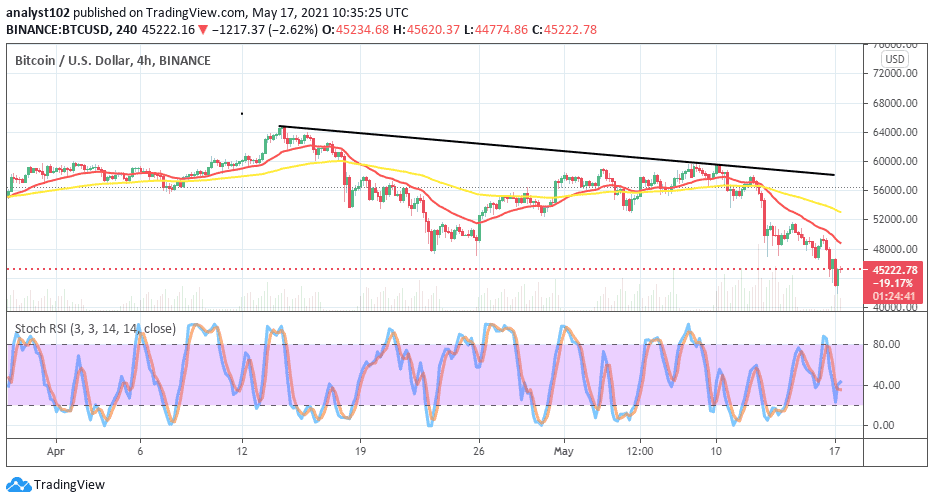
BTC/USD 4-hour Chart
The medium-term chart clearly shows that the BTC/USD trade is under a falling pressure. The downward movements resumed during the May 12 session and, it eventually led to the crossing of the 50-day SMA indicator by the 14-day SMA to the south on a subsequent day. Since then, there have been variant bearish candlesticks on the sell signal side of the smaller SMA. The Stochastic Oscillators are now down to place around range 40. They now seemingly show a sign of crossing back to the north. The present trading formation outlook hasn’t suggested a brighter outlook for a bullish upswing return.
Join Our Telegram channel to stay up to date on breaking news coverage