Join Our Telegram channel to stay up to date on breaking news coverage
Bitcoin Price Prediction – February 21
The Bitcoin price is currently down with 1.75% after touching the daily high of $39,506 as it is now moving towards the $37,000 support.
BTC/USD Long-term Trend: Bearish (Daily Chart)
Key levels:
Resistance Levels: $44,000, $46,000, $48,000
Support Levels: $33,000, $31,000, $29,000
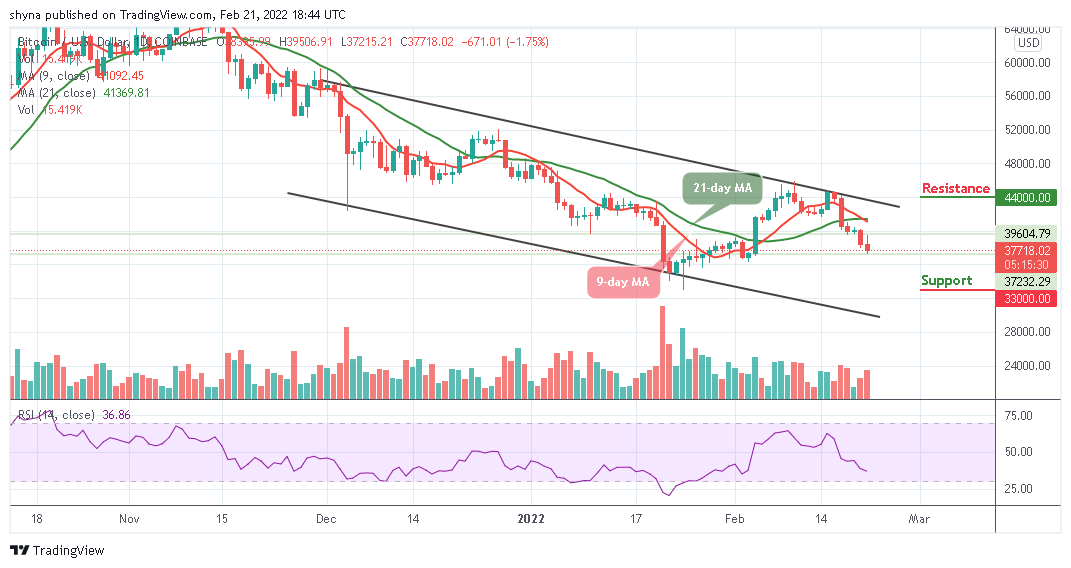
The daily chart reveals that BTC/USD could not break above the previous resistance level of $38,000 with the current consolidation pattern as the Bitcoin price fails to cross above the 9-day and 21-day moving averages. The king coin may likely see another sharp drop towards the lower boundary of the channel. However, the red-line of the 9-day MA is crossing below the green-line of the 21-day MA as the Relative Strength Index (14) heads lower.
Bitcoin Price Prediction: Bitcoin (BTC) Ready for Serious Downtrends
The daily chart reveals that the Bitcoin price refuses to stay above the resistance level of $38,000 as the king coin prepares for another few days of the bearish movement. Therefore, the first support level could be located at $35,000. Beneath this, other supports lie at $33,000, $31,000, and $29,000.
At the time of writing, the Bitcoin price is falling towards the south as the king coin touches the new daily low of $37,215 but the candle is still yet to close, however, it does look unlikely that the bulls may end up closing above the $38,000 level. On the contrary, if the buyers decide to push the coin above the upper boundary of the channel, potential resistance levels could be located at $44,000, $46,000, and $48,000.
BTC/USD Medium-Term Trend: Bearish (4H Chart)
The 4-hour chart shows that the Bitcoin bears are now dominating the market pushing the price towards the support level of $37,000. Although the Bitcoin price has not yet slipped below $37,500 at the time of writing, it’s still in the loop of making a bounce back.
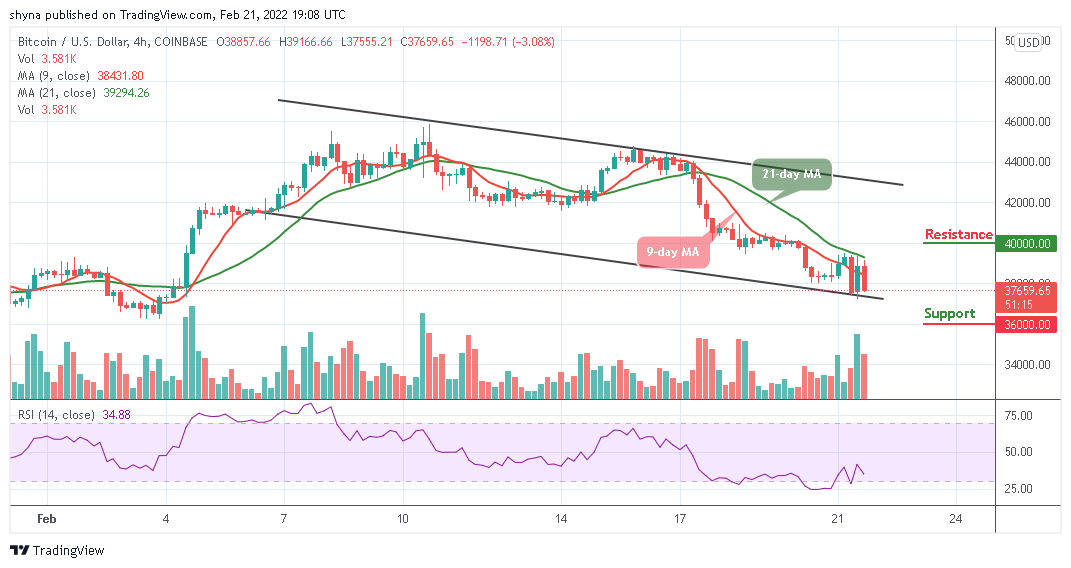
Presently, the Bitcoin price is likely to cross below the lower boundary of the channel but the upward movement may locate the nearest resistance at $40,000 and above. Therefore, any further bearish movement may hit support at $36,000 and below. The technical indicator Relative Strength Index (14) is likely to revisit the oversold region as the signal line faces down.
Looking to buy or trade Bitcoin (BTC) now? Invest at eToro!
68% of retail investor accounts lose money when trading CFDs with this provider
Read more:
- How to buy Bitcoin
- How to buy Cryptocurrency
Join Our Telegram channel to stay up to date on breaking news coverage