Join Our Telegram channel to stay up to date on breaking news coverage
Bitcoin Price Prediction – December 4
Today, the Bitcoin price prediction loses traction after hitting $42,333; losses likely to continue in the near term as reveals by the daily chart.
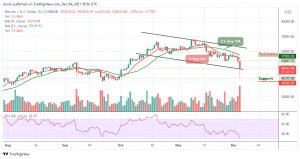
BTC/USD Long-term Trend: Bearish (Daily Chart)
Key levels:
Resistance Levels: $57,000, $59,000, $61,000
Support Levels: $40,000, $38,000, $36,000

Since the past few days, traders can easily see that BTC/USD is back in the red zone posting major losses of 8.77% on the day after commencing the trading at $53,633. However, the market movement has an intraday high of $53,876; although the world’s largest crypto touches the support level of $42,333 before going back to where it is currently trading at $48,933.
Bitcoin Price Prediction: The Bitcoin Price Ready to Plunge More
The Bitcoin price just moves toward the support level of $43,000, marking $42,333 as the current daily low at the moment. Does this mean that Bitcoin (BTC) is finally searching for a new low? As the daily volume candle supports the bears, together with the 9-day MA moving below the 21-day MA, it can be assumed that a stronger bearish movement may surface within the market.
At the time of writing, BTC/USD is struggling to maintain the $49,000 level and if the coin follows the downward trend as the technical indicator Relative Strength Index (14) aims to cross into the oversold region, the next supports may likely come at $40,000, $38,000, and $36,000. On the contrary, if the coin moves above the 9-day moving average, the further movement could face the upper boundary of the channel to send the price to the resistance levels of $57,000, $59,000, and $61,000 which will be well above the channel.
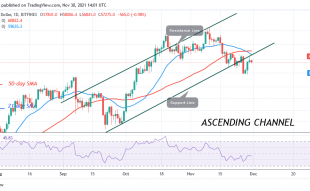
BTC/USD Medium-Term Trend: Bearish (4H Chart)
On the 4-Hour chart, the Bitcoin price hovers below the lower boundary of the channel to touch the low of $46,200 which may take time to persistently trade above $49,000. However, should the bulls gather enough strength and cross above the 9-day moving average; the upward movement may be able to near the resistance levels of $52,000 and above.
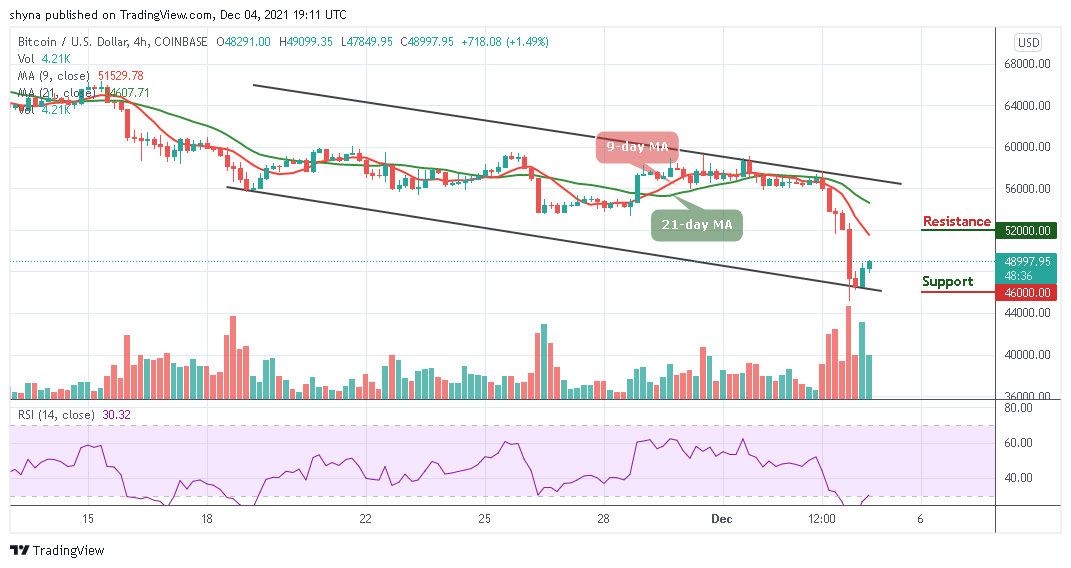
However, on the downside, immediate support could be located at $48,000 level while the main support is at the $47,000 level. The price may likely fall below the critical support level of $46,000 and below if the bears put more pressure into the market, a further movement could push the coin below the lower boundary of the channel. Looking at it technically, the Relative Strength Index (14) is trying to move out of the oversold region.
Looking to buy or trade Bitcoin (BTC) now? Invest at eToro!
68% of retail investor accounts lose money when trading CFDs with this provider
Read more:
- How to buy Bitcoin
- How to buy Cryptocurrency
Join Our Telegram channel to stay up to date on breaking news coverage