Join Our Telegram channel to stay up to date on breaking news coverage
Bitcoin Price Prediction – March 27
The Bitcoin price is hovering at $44,907 after touching the daily high of $45,042 at the beginning of today.
BTC/USD Long-term Trend: Ranging (Daily Chart)
Key levels:
Resistance Levels: $50,000, $52,000, $54,000
Support Levels: $40,000, $38,000, $36,000
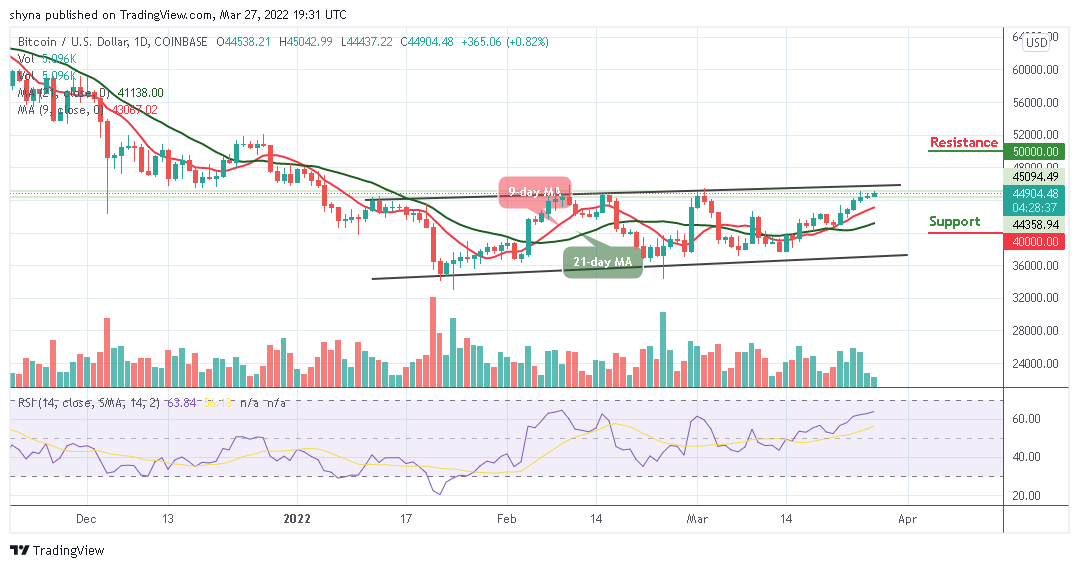
BTC/USD may face higher levels as the latest move could mark an upward break of the bullish phase. However, it is important to note that the bulls are yet to push the Bitcoin price above the resistance level of $45,000. Consequently, the Bitcoin price has been trying to cross into the positive side since the European session.
Bitcoin Price Prediction: Can Bitcoin (BTC) Head to the Upside?
The Bitcoin price is trading up above its opening price of $44,538 as the current movement marks a slight climb from where it has been trading for the past few days. However, it is important to note that this current level could launch a bullish break above the upper boundary of the channel. More so, as the technical indicator Relative Strength Index (14) crosses above 60-level, the king coin is preparing to face the upside.
Nevertheless, a constant bullish movement above the channel may locate the nearest resistance at $48,000 before reaching the potential resistance levels of $50,000, $52,000, and $54,000. Furthermore, if the technical indicator Relative Strength Index (14) withdrawals below 60-level, BTC/USD may experience another bearish movement and this could head to the support levels at $40,000, $38,000, and $36,000.
BTC/USD Medium-Term Trend: Bullish (4H Chart)
Looking at the 4-hour chart, BTC/USD needs to stay above the 9-day and 21-day moving averages in other to mitigate the short-term bullish pressure and allow for an extended recovery towards $45,000. Therefore, a higher resistance level may be located at $47,000 and above.
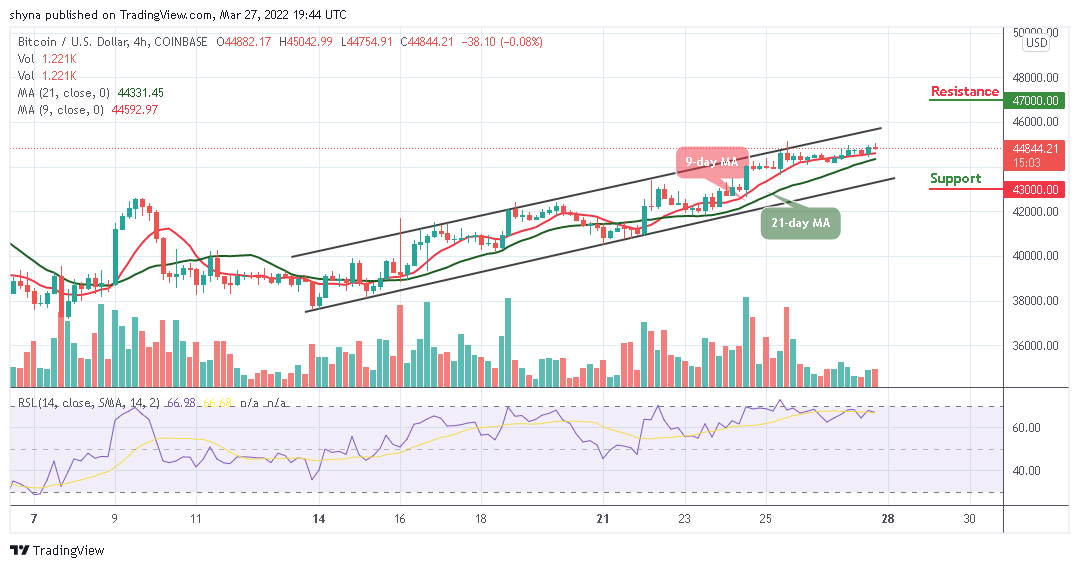
However, the Bitcoin price is likely to fall below the 9-day MA as a sustainable move below this barrier may increase the downside pressure to the support level of $43,000 and below. Meanwhile, the technical indicator Relative Strength Index (14) moves below 70-level suggesting bearish movement.
Looking to buy or trade Bitcoin (BTC) now? Invest at eToro!
68% of retail investor accounts lose money when trading CFDs with this provider
Read more:
- How to buy Bitcoin
- How to buy Cryptocurrency
Join Our Telegram channel to stay up to date on breaking news coverage