Join Our Telegram channel to stay up to date on breaking news coverage
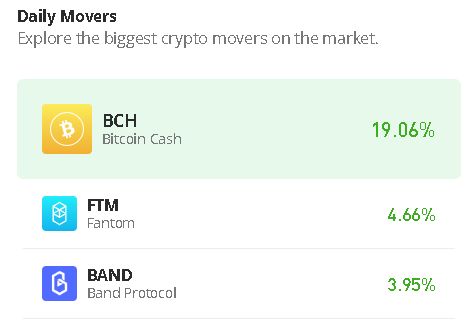
The Bitcoin Cash price prediction is recovering from the daily opening price at the $135.9 level as the price continues to fluctuate.
Bitcoin Cash Prediction Statistics Data:
- Bitcoin Cash price now – $135.2
- Bitcoin Cash market cap – $3 billion
- Bitcoin Cash circulating supply – 19.4 billion
- Bitcoin Cash total supply – 19.4 billion
- Bitcoin Cash Coinmarketcap ranking – #27
BCH/USD Market
Key Levels:
Resistance levels: $160, $165, $170
Support levels: $115, $110, $105
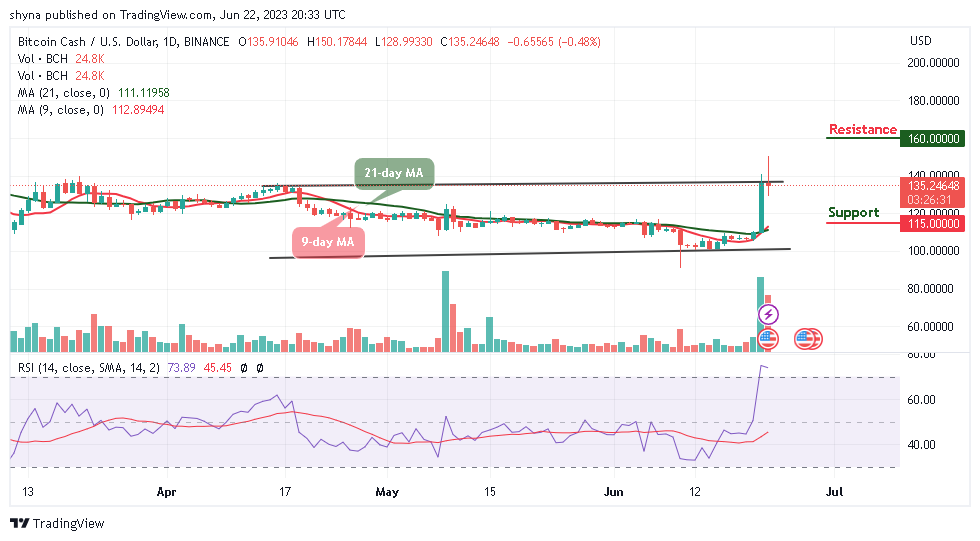
BCH/USD is likely to spike above the upper boundary after touching the daily high at the $150.1 resistance level. At the time of writing, Bitcoin Cash is changing hands at $135.2, since the beginning of the European session. However, with latest the recovery, the digital asset may continue to stay above the 9-day and 21-day moving averages to increase the bullish movement.
Bitcoin Cash Price Prediction: Can BCH Break Above $150?
The Bitcoin Cash price is likely to reclaim the resistance level of $150. However, if the bulls push the coin above the upper boundary of the level, BCH/USD may touch the resistance levels of $160, $165, and $170 to keep the price on the upside. On the contrary, any strong selling pressure below the 21-day moving average may drag the price toward the lower boundary of the channel if the bears step back into the market.
Moreover, should in case Bitcoin Cash trade below the moving averages, a bearish continuation could bring the price to the supports of $115, $110, and $105. Meanwhile, the technical indicator Relative Strength Index (14) may remain within the overbought region and this could indicate more bullish signals.
Against Bitcoin, the Bitcoin Cash price is likely to head to the south if it failed to cross above the upper boundary of the channel. However, following the recent positive sign, the current market movement may continue to follow an uptrend if the buyers reclaim the resistance level of 497 SAT.
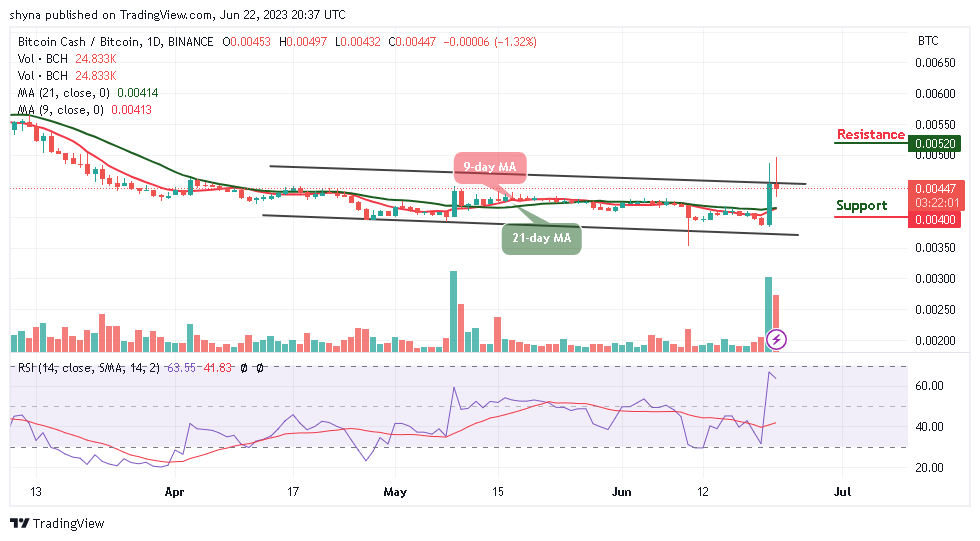
Therefore, as the technical indicator, Relative Strength Index (14) remains above the 60-level, once it increases the bullish pressure, the market price could hit the resistance level of 520 SAT and above. Meanwhile, a retest below the 9-day and 21-day moving averages could lower the price to the support level of 400 SAT and below.
Alternatives to Bitcoin Cash
The Bitcoin Cash price is likely to break above the upper boundary of the channel as the coin touches the resistance level of $160. Since a few days ago, BCH/USD has been trading above the 9-day and 21-day moving averages and this refrains the coin from going back to the support level of $125.
However, Wall Street Memes crypto has massive potential since it already has a vast audience. With over one million followers across all platforms, the token enables people to join the Wall Street Memes community and the culture that drives it. Moreover, the token is currently in the presale stage as almost $10m has been raised so far.
New OKX Listing - Wall Street Memes

- Established Community of Stocks & Crypto Traders
- Featured on Cointelegraph, CoinMarketCap, Yahoo Finance
- Rated Best Crypto to Buy Now In Meme Coin Sector
- Team Behind OpenSea NFT Collection - Wall St Bulls
- Tweets Replied to by Elon Musk
Join Our Telegram channel to stay up to date on breaking news coverage