Join Our Telegram channel to stay up to date on breaking news coverage
BCH Price Prediction – July 18
The Bitcoin Cash shows an amazing intraday hike as it rises from yesterday’s low of $221 to currently trading above $225.
BCH/USD Market
Key Levels:
Resistance levels: $240, $260, $280
Support levels: $210, $190, $170
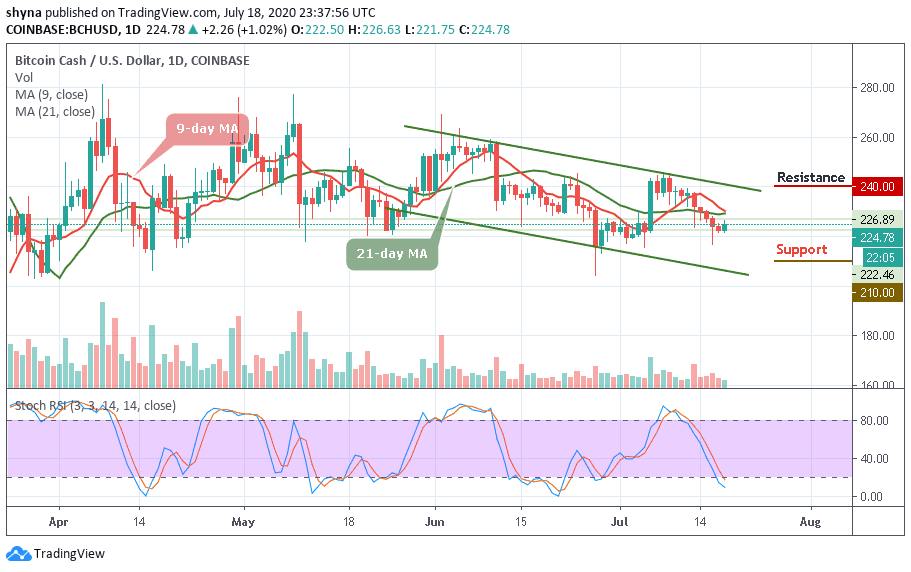
BCH/USD is seen pushing the price above the critical resistance level. The coin is trading above $222 to trade at $224.78 at the time of writing. The Bitcoin Cash is also seen focusing on the bullish momentum after a sustainable break above an important technical level. More so, the coin has gained over 1.0% since the beginning of the day as it is using $221 support as a jumping-off ground to develop the upside momentum, which is now gaining traction.
However, on the upside, if BCH/USD cross above the 9-day and 21-day moving averages, the price may break through the resistance level of $230 and $235 respectively. Meanwhile, the technical indicator shows that the bulls are ready for action especially when the up-trending stochastic RSI begins. Any further bullish movement above the channel may pave the way the resistance levels of $240, $260, and 280.
In other words, if the price falls below $220 level, the market may be compelled either to a range-bound or begin a downward movement. This may likely serve as a major blow for the market sentiments as traders could interpret it as a sign of underlying weakness. The next important support comes at $215, which may be followed by $210, $190, and $170 support levels.
Looking at BCH/BTC, one thing to note here is that the market is preparing to change the trend and a short-term bullish breakout may likely play out because the technical indicator stochastic RSI may soon be moving out of the oversold zone and this could find the nearest resistance level at 0.026 BTC and above.

However, peradventure the buyers failed to hold the support of 0.0240 BTC, the market price may likely continue a downward movement, while dropping further may bring the coin to the support level of 0.0230 BTC and below.
Join Our Telegram channel to stay up to date on breaking news coverage