Join Our Telegram channel to stay up to date on breaking news coverage
BCH Price Analysis – June 9
The daily chart reveals that the Bitcoin Cash seems to be caught between the bull and the bear as the price moves sideways.
BCH/USD Market
Key Levels:
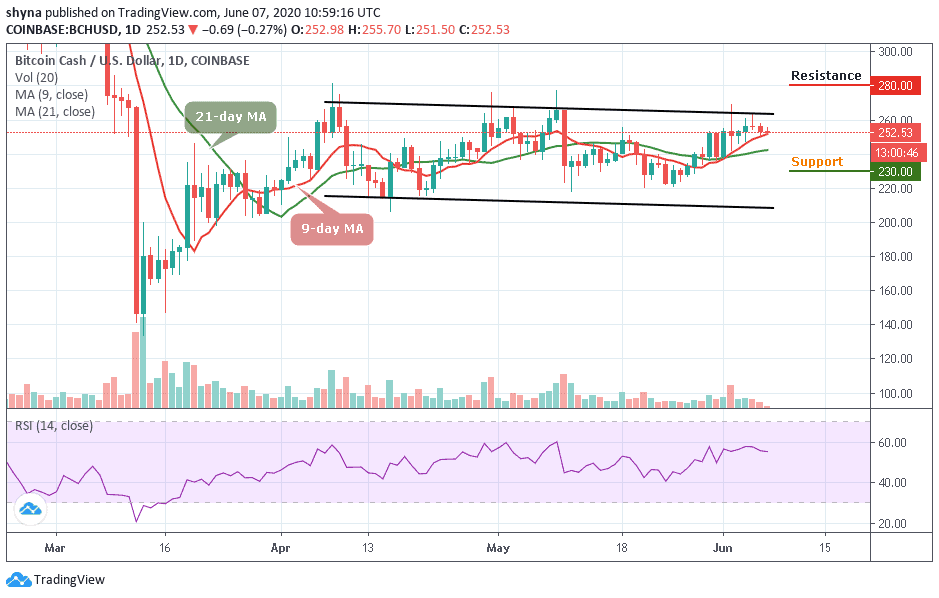
Resistance levels: $270, $290, $310
Support levels: $240, $220, $200
BCH/USD has been showing an uneven movement and it has not been able to maintain a consistent bullish run. Therefore, the price of Bitcoin Cash may continue to show some signs of a downward movement slowly till the latter part of the day. Meanwhile, for the past few days, the market has been forming a pattern where the day begins with either having an uptrend or downtrend, but towards the end, it reverses.
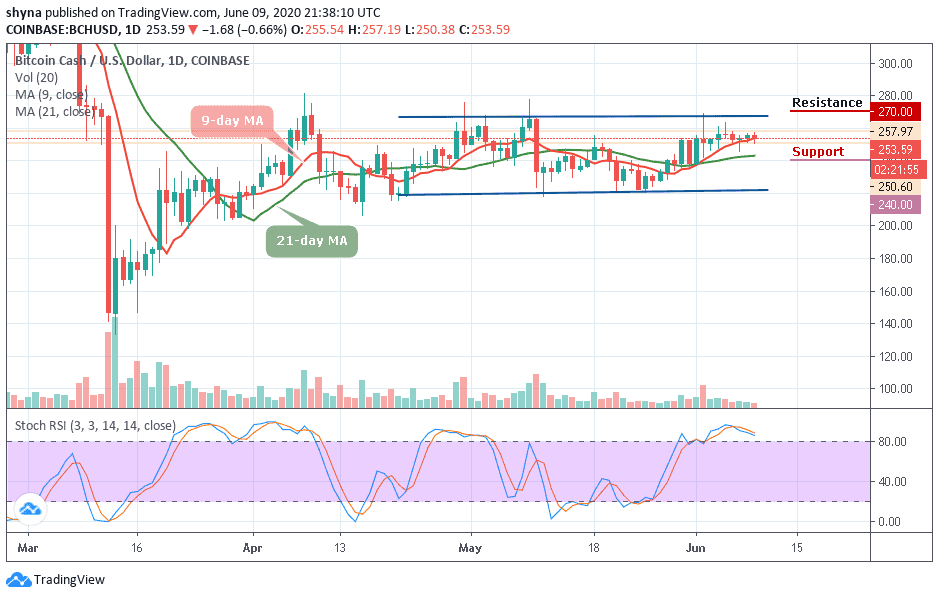
However, the BCH price continues to consolidate itself in a flag formation, waiting for a cross below the 9-day moving average. More so, the daily breakdown reveals that BCH/USD dropped to $250.60 after the opening of the market today where it corrected itself to where it is trading currently at $253 level. If the support gets weak, a price break-down may occur as the bears may find new weekly lows at $240, $220, and $200 support levels.
Nevertheless, a bullish continuation may likely roll back the market to $260 resistance with a possible break out of the channel and could move towards the $270, $290, and $310 resistance levels, establishing a new weekly high for the market. At the moment, the technical indicator stochastic RSI is still moving within the overbought zone, bearish signals may likely play out.
BCH/BTC Market
Comparing with Bitcoin, the recent sideways movement is due to price stability. At the moment, the market is preparing to change the trend and a short-term bearish breakout is most likely to play out because the technical indicator RSI (14) moves below 50-level and this could find the nearest support levels at 0.024 BTC and below.
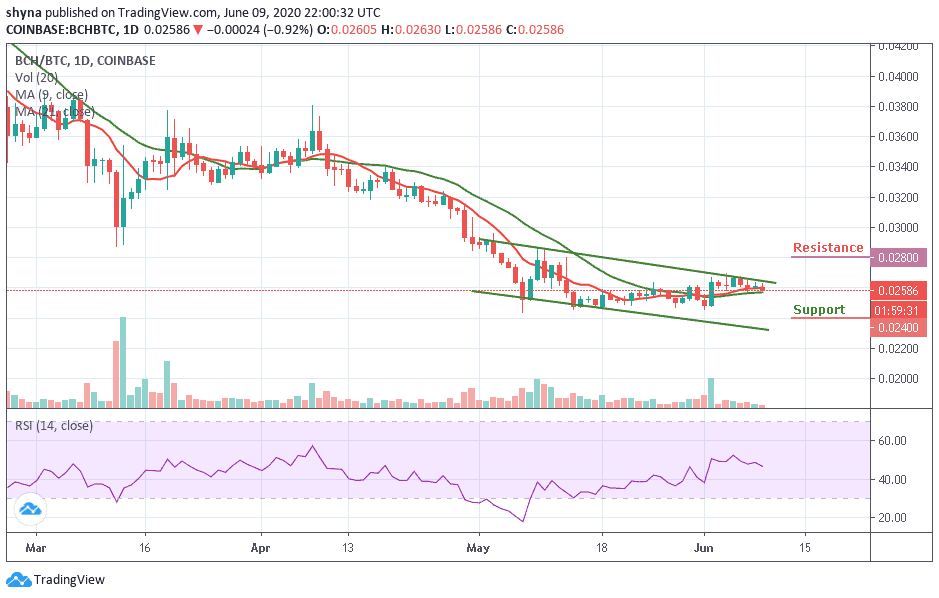
However, the only condition for the resumption of the bullish trend is if the 0.025 BTC level continues to provide support for the market, then the price may be pushed to the resistance level of 0.028 BTC and above. Meanwhile, the BCH/BTC pair continues to remain in sideways movement hovering around the moving averages.
Join Our Telegram channel to stay up to date on breaking news coverage