Join Our Telegram channel to stay up to date on breaking news coverage
Bitcoin Price Prediction – December 28
The BTC/USD market reverses valuation around $50,000 after, making several attempts to average the resistance line at $52,500. Presently, the market’s percentage rate is about 3.50 negatives, trading around $48,961. Initially, as of today, the price has reached a high point of $50,769 and, the lower value is $48,233.
BTC/USD Market
Key Levels:
Resistance levels: $52,500, $55,000, $57,500
Support levels: $47,500, $45,000, $42,500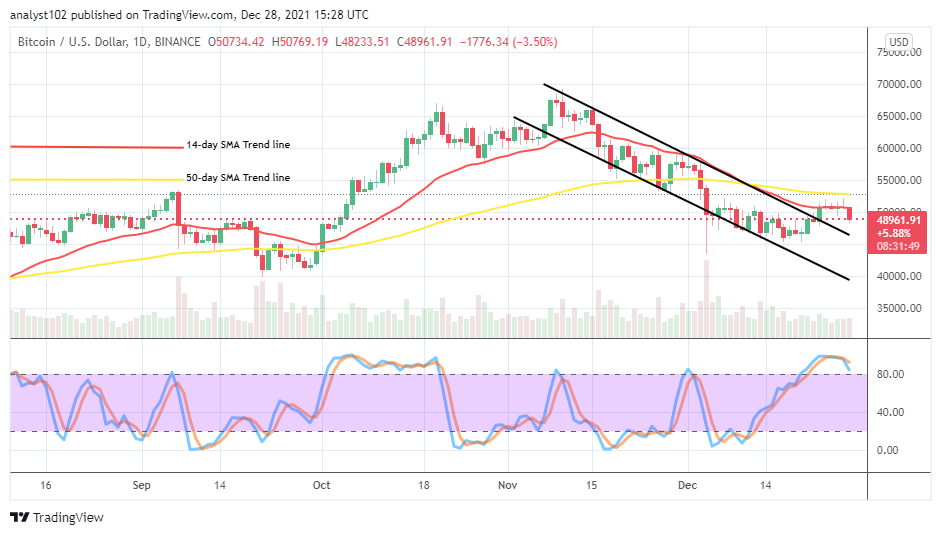 BTC/USD – Daily Chart
The BTC/USD daily chart reveals that the crypto-economic market reverses valuation at $50,000, following a line of occurrences of variant tinier bearish pin bar candlesticks underneath the trend line of the bigger SMA. The 14-day SMA indicator is underneath the 50-day SMA indicator. The Stochastic Oscillators have crossed the lines southbound in the overbought region closer to the range of 80. That suggests that the market may result in another operation of price corrections.
What could be the traders’ approach to trading the BTC/USD instrument now as the crypto market reverses valuation at $50,000?
In the first place, the BTC/USD buyers would have to exercise some degrees of patience and be alert to get the time that price rebound after finding support at a lower trading spot as the market reverses valuation at $50,000. A bearish candlestick is in the making, portending further slippages and, that requires buying orders to suspend until a while. The supports between $47,500 and $45,000 may be the maximum the current depression movement may push on a heightening motion to get exhausted in the long run.
Looking more at the downside of the BTC/USD market technical analysis, sellers currently have a brighter chance to push down the market trading activities by capitalizing more efforts on the current pace, as indicated by the bearish candlestick. The $50,000 level has to focus on to see that no bounce-off trading is made against it to keep the validity of a selling position.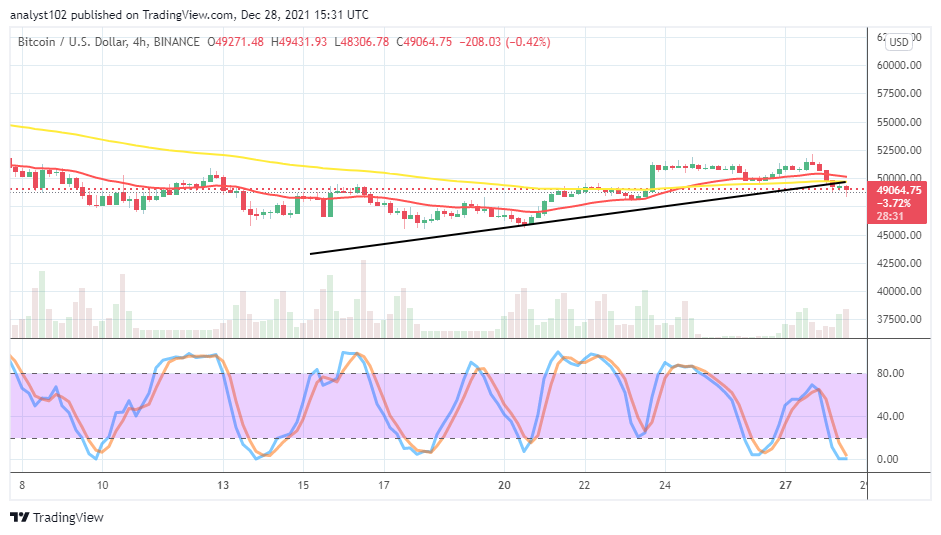
BTC/USD 4-hour Chart
The BTC/USD 4-hour chart showcases that the crypto market reverses valuation at $50,000, involving all the indicators as well. The 14-day SMA trend line has briefly bent toward the 50-day SMA trend line from the top. The bullish trend line drew in a supportive style to the bigger SMA. The Stochastic Oscillators are dipped into the oversold region, trying to close within. That suggests that the crypto economy may not go undervaluing for a long time before making a round of another upswing against the US currency.
Looking to buy or trade Bitcoin (BTC) now? Invest at eToro!
68% of retail investor accounts lose money when trading CFDs with this provider.
Read more:
- How to buy Bitcoin
- How to buy cryptocurrency
Join Our Telegram channel to stay up to date on breaking news coverage