
Join Our Telegram channel to stay up to date on breaking news coverage
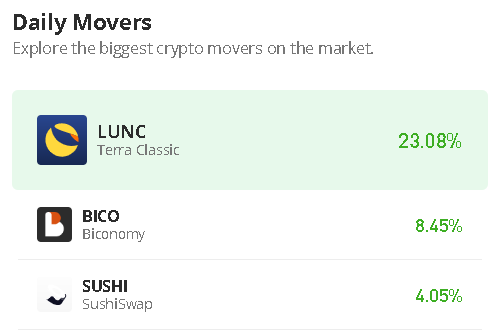
The Biconomy price prediction reveals that BICO crosses above the moving averages as the coin gets ready for an upward movement.
Biconomy Prediction Statistics Data:
- Biconomy price now – $0.28
- Biconomy market cap – $72.5 million
- Biconomy circulating supply – 255 million
- Biconomy total supply – 1 billion
- Biconomy Coinmarketcap ranking – #246
BICO/USD Market
Key Levels:
Resistance levels: $0.40, $0.45, $0.50
Support levels: $0.20, $0.15, $0.10
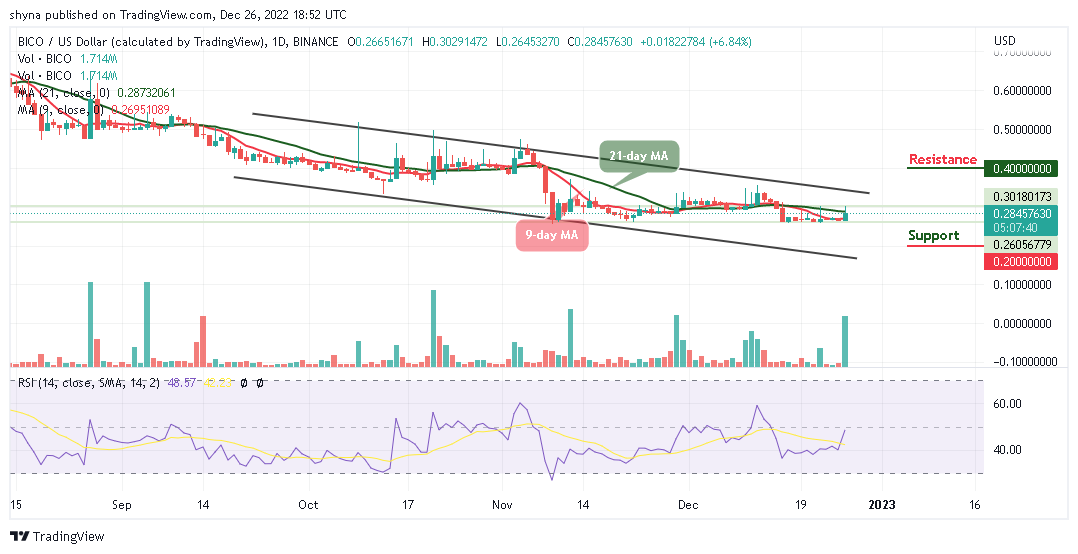
BICO/USD touches the resistance level of $0.30, after which it couldn’t maintain the trend as the price dropped and stayed trading within the 9-day and 21-day moving averages. However, the price not reflecting towards the upper boundary of the channel ruins the long-term technical picture of the coin. Therefore, the Biconomy price will have to reclaim the resistance level of $0.30 to increase the buying pressure while the closest resistance expects the coin at $0.35, which could be the daily high.
Biconomy Price Prediction: BICO May Extend the Upward Movement
The Biconomy price crosses above the 9-day and 21-day moving averages but a movement towards the south could bring the coin to the support levels of $0.20, $0.15, and $0.10. From above, a sustained move above the upper boundary of the channel may create momentum for the bulls with the focus to move the market to the next resistance levels of $0.40, $0.45, and $0.50 respectively.
At the time of writing, the technical indicator Relative Strength Index (14) signal line is likely to cross above the 50-level, which indicates that BICO/USD may continue to trade bullishly. Meanwhile, the 9-day MA may need to cross above the 21-day MA for the buyers to concentrate on stirring action to the north.
When compares with BTC, following the trade for the past few days, bulls have shown a great commitment to BICO trading by following the recent positive sign. Moreover, the current market trend may continue to go up if the buyers can sustain the pressure further.
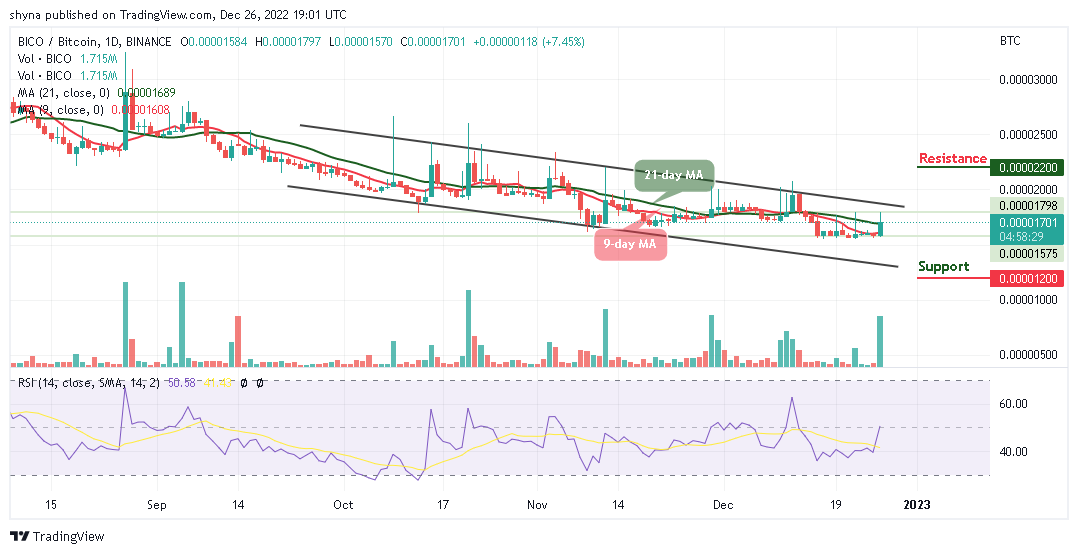
However, if the bulls succeeded in pushing the coin above the upper boundary of the channel, the market price may likely reach the next resistance level of 2200 SAT and above. On the contrary, a retest could allow the coin to go below the 9-day and 21-day moving averages and lower the price to the support level of 1200 SAT and below. Meanwhile, the technical indicator Relative Strength Index (14) is moving to cross above the 50-level, suggesting additional bullish signals into the market.
Dash 2 Trade gives you the ability to optimize your trading and speculative profitability with effective crypto trading recommendations, auto trading, and analytics features. There is a D2T token presale ongoing and time is running out. The presale dashboard launch is coming soon since the product dev is ahead of the schedule. So far, the presale has raised almost $11 million.
Related
- D2T Price Prediction
- How to Buy D2T
Join Our Telegram channel to stay up to date on breaking news coverage