Join Our Telegram channel to stay up to date on breaking news coverage
BCH Price Analysis – March 15
The Bitcoin Cash could extend the breakdown back below the $500 support if the price fails to hold within the ascending parallel channel.
BCH/USD Market
Key Levels:
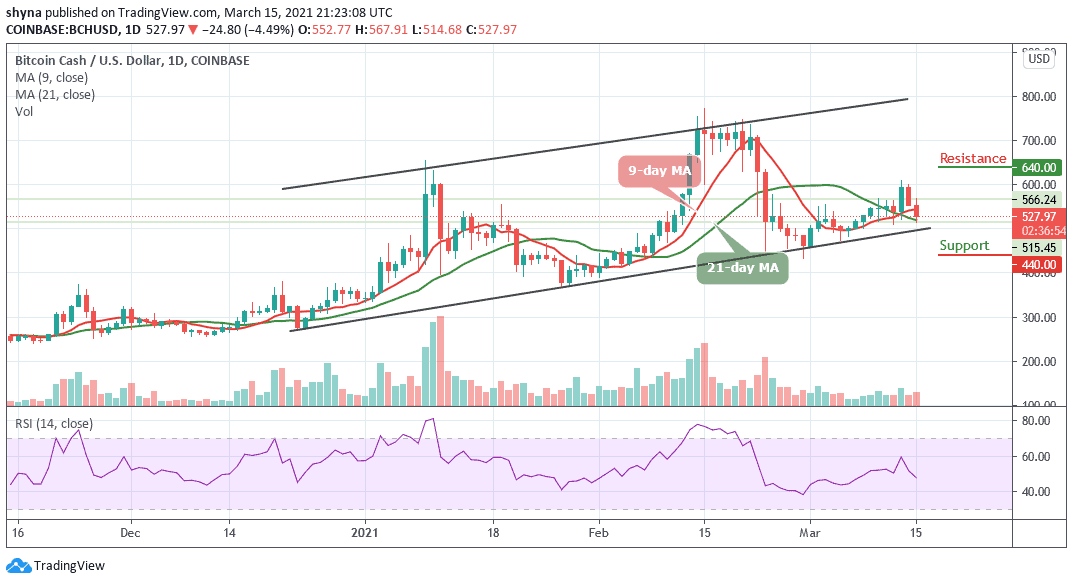
Resistance levels: $640, $660, $680
Support levels: $440, $420, $400
BCH/USD is currently showing an uneven movement with a tremendous fall more than rising today as the coin has not been able to maintain a consistent bullish run since yesterday. However, for the past few days, the market has been forming a pattern where the day begins with either having an uptrend or downtrend, but towards the end, it reverses.
What to Expect from Bitcoin Cash (BCH)
The Bitcoin Cash price may continue to consolidate itself in a flag formation, waiting for a cross below the 21-day moving average. More so, the daily breakdown reveals that BCH/USD before touching $567.91, dropped to $514.68 at the opening of the market today after which it corrected itself to where it is trading currently at $527.97 level. If the support gets weak, a price break-down may occur as the bears may find new weekly lows at $440, $420, and $400 support levels.
On the other hand, a bullish movement may likely roll the market back to $630 resistance and could move towards the $640, $660, and $680 resistance levels, establishing a new weekly high for the market. For now, the RSI (14) indicator is moving below the 50-level. Meanwhile, a bullish cross above 60-level might return bulls back to the market.
Against Bitcoin, Bitcoin Cash continues to perform very low due to a recurring bearish sentiment which is causing the market to fall drastically. However, as the price falls, sellers are seen posing an additional threat for buyers. Meanwhile, any eventual break below the lower side of the descending channel may cause the coin to collapse.
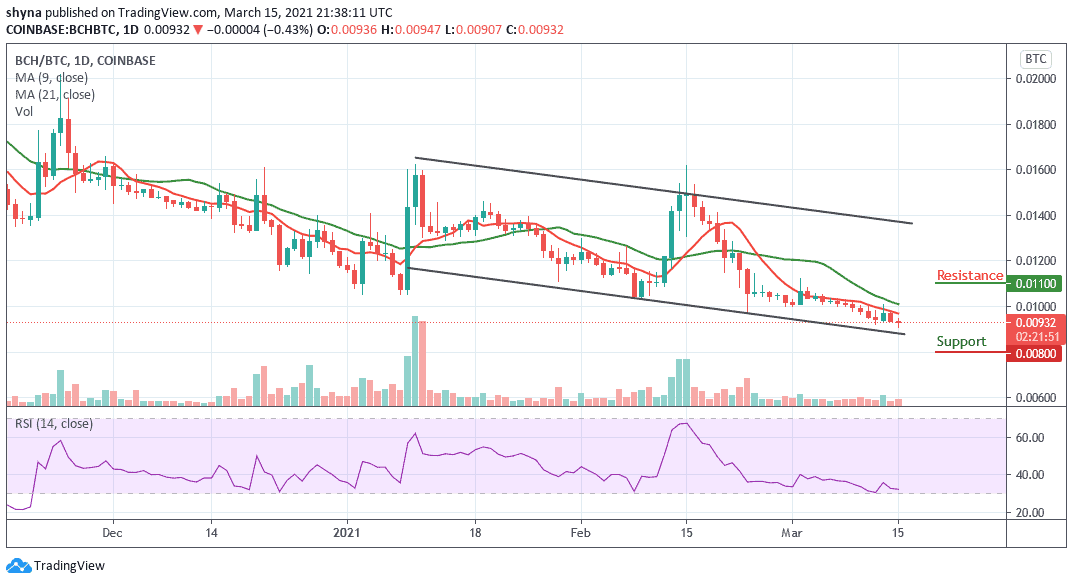
However, for a positive upsurge, the 0.011 BTC and above are the major resistance levels for the coin for now but a bearish continuation could test the important support at the 0.008 BTC and below. More so, the trading volume is fading away as the RSI (14) moves below 35-level, keeping the price at the negative side.
Join Our Telegram channel to stay up to date on breaking news coverage