Join Our Telegram channel to stay up to date on breaking news coverage
BCH Price Prediction – December 2
The Bitcoin Cash upward direction is revealing as the bull gains momentum.
BCH/USD Market
Key Levels:
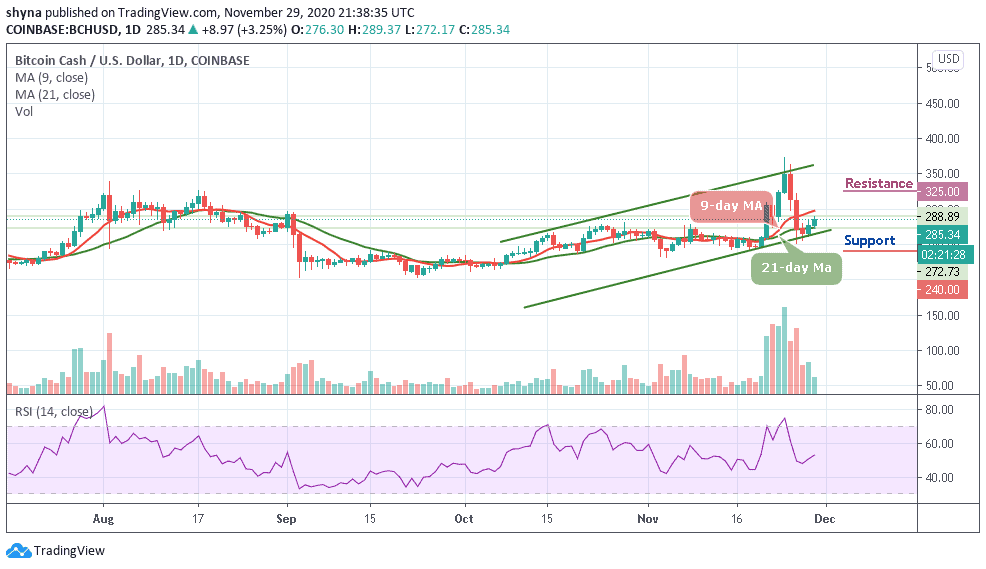
Resistance levels: $340, $360, $380
Support levels: $240, $220, $200
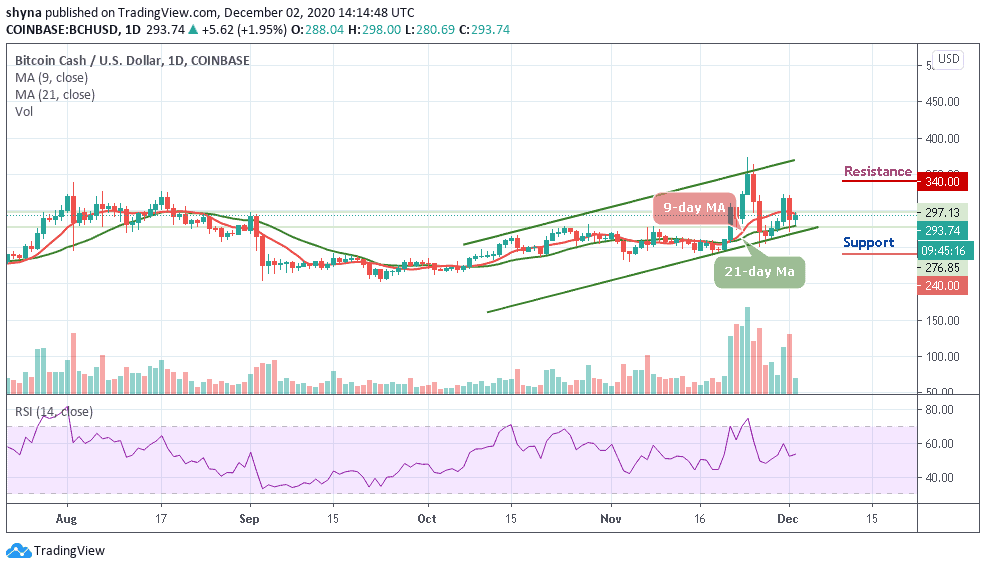
BCH/USD is hovering at $293.74 after touching the daily at $298, the coin is seen focusing on the bullish momentum after a sustainable break above the 21-day moving average. More so, the coin gains 1.95% within 24 hours as it is using the trend-line at $270 support as a jumping-off ground to develop the upside momentum.
What to Expect from BCH/USD
Looking at the daily chart, BCH/USD price action is now following the upward movement but a retracement move may reach the closest support level at $270 before the rally begins. Therefore, if bounce up failed, the retracement might last to the $250 support level. However, bear dominance may be increasing by volume. Yesterday’s spike was much-anticipated for, and confirmation for bear-run. The next key support levels are located at $240, $220, and $200.
Looking at it positively, if BCH/USD stays above the 9-day and 21-day moving averages, the market price may likely break-through another resistance at $300 and $320 respectively. Meanwhile, the technical indicator shows that the bulls are still in control as the signal line remains above the 50-level. Therefore, further bullish movement may pave the way to the resistance levels of $340, $360, and 380.
When compares with BTC, the Bitcoin Cash is range-bound as the market may begin to move sideways while it remains under the 9-day and 21-day moving averages within the descending channel while the technical indicator RSI (14) moves above the 40-level.
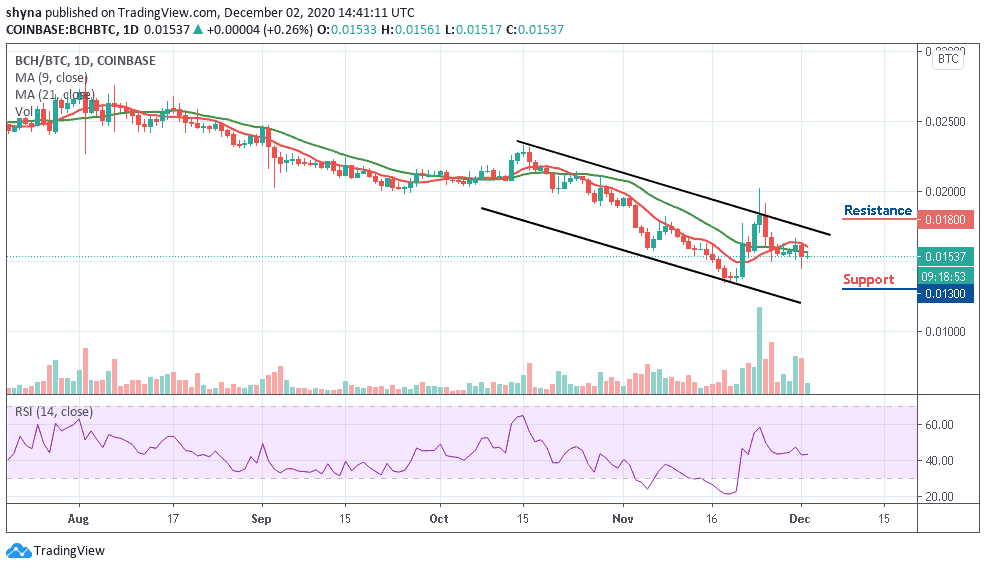
Meanwhile, the bearish continuation may begin to increase the selling pressure. And if the bears succeeded in dominating the market, BCH/BTC may likely fall to the support level of 0.130 BTC and below. Meanwhile, a rebound could push the price above the moving averages, and crossing above the upper boundary of the channel may increase it to the resistance level of 0.0180 BTC and above.
Join Our Telegram channel to stay up to date on breaking news coverage