
Join Our Telegram channel to stay up to date on breaking news coverage
The Arbitrum price prediction is consolidating and seems to be preparing for the next move above the moving averages.
Arbitrum Prediction Statistics Data:
- Arbitrum price now – $8.33
- Arbitrum market cap – $1.83 billion
- Arbitrum circulating supply – 1.27 billion
- Arbitrum total supply – 10 billion
- Arbitrum Coinmarketcap ranking – #33
ARB/USD Long-term Trend: Ranging (Daily Chart)
Key levels:
Resistance Levels: $9.50, $10.00, $10.50
Support Levels: $7.50, $7.00, $5.50
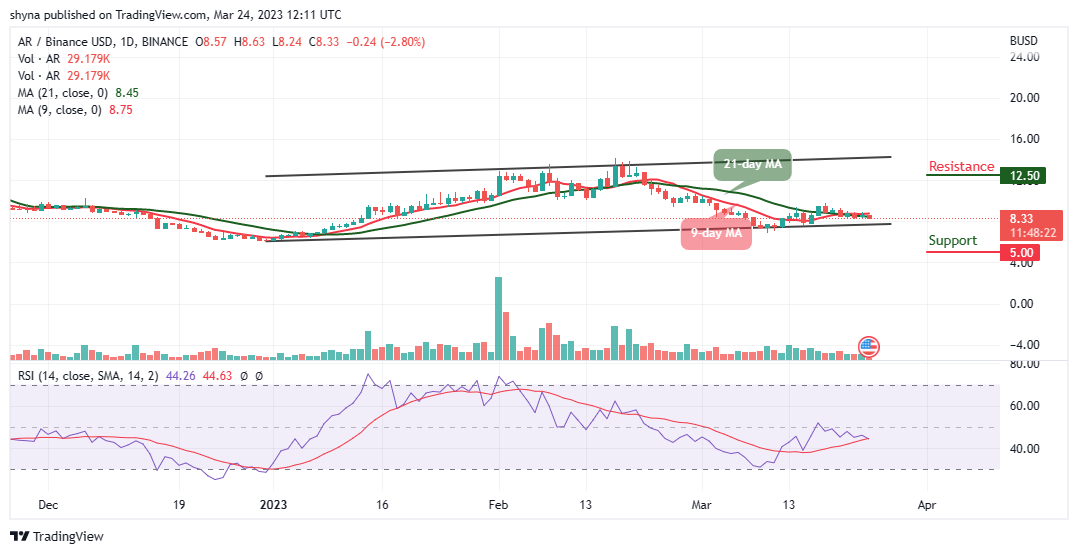
The daily chart reveals that ARB/USD couldn’t break the resistance level of $8.55 with the current consolidation pattern as it fails to cross above the 9-day and 21-day moving averages. Meanwhile, the nearest support level could be located around $8.00. Beneath this, other supports could be found at $7.50, $6.00, and $5.50 levels.
Arbitrum Price Prediction: Arbitrum (ARB) May Retreat Before Going Higher
The Arbitrum price is seen sliding below the 9-day and 21-day moving averages. However, a break below the lower boundary of the channel may bring Arbitrum down to reach the $8.00 level; however, this could also be confirmed by the Relative Strength Index (14) as the signal line moves to cross below the 40-level. On the next positive move, traders can see ARB likely to break up above the moving averages. Although the candle is still yet to close, however, it does look that the bulls may end up closing above the 21-day moving average as the potential resistance levels could be found at $9.50, $10.00, and $10.50.
ARB/USD Medium-Term Trend: Bullish (4H Chart)
Looking at the 4-hour chart, ARB/USD may need to recover above $8.55 and move toward the upper boundary of the channel to mitigate the short-term bearish pressure in other to hit the nearest resistance level of $9.00. However, any further bullish movement could hit the resistance level at $9.50 and above.
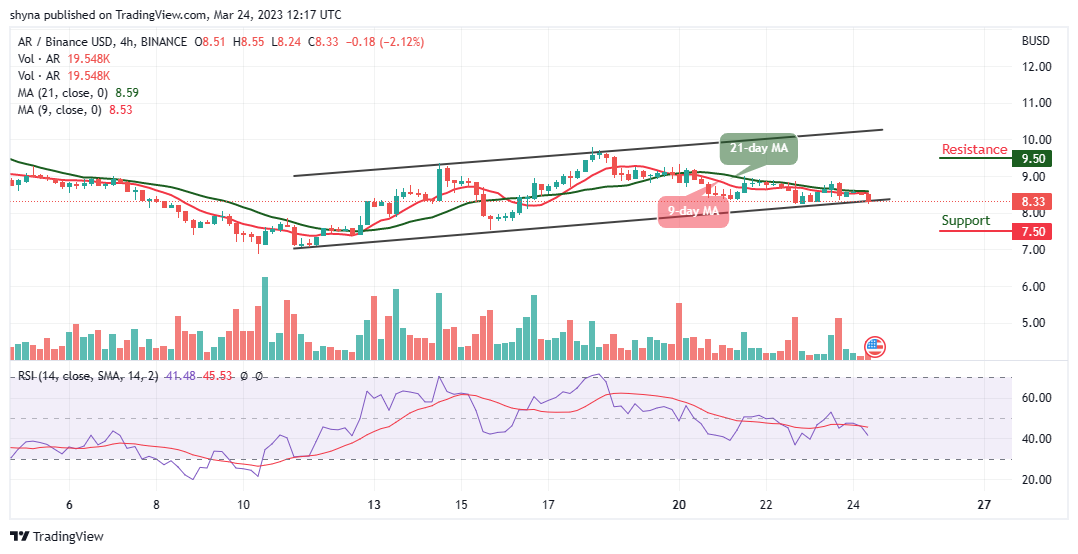
However, the nearest support may come at $8.00 and a sustainable bearish movement will increase the downside pressure and could hit the support level at $7.50 and below. Considering that the technical indicator Relative Strength Index (14) is moving to cross below the 40-level, suggesting that bearish signals may come into play.
Alternatives to Arbitrum
The Arbitrum price may cross above the 9-day and 21-day moving averages if the buyers increase the pressure; however, this is likely to happen with each failed breakout attempt as the technical indicator Relative Strength Index (14) moves to cross below the 40-level. Meanwhile, the Love Hate Inu token has already raised close to $2 million since its presale launched. However, LHINU has the potential to be the next big crypto. Through the presale, the token’s price will increase, paving the way for new exchange listings.
Join Our Telegram channel to stay up to date on breaking news coverage