Join Our Telegram channel to stay up to date on breaking news coverage
The Arbitrum price prediction is likely to cross above the upper boundary of the channel but could fall below the moving averages if the bears step back.
Arbitrum Prediction Statistics Data:
- Arbitrum price now – $1.21
- Arbitrum market cap – $2 billion
- Arbitrum circulating supply – 1.27 billion
- Arbitrum total supply – 10 billion
- Arbitrum Coinmarketcap ranking – #34
ARB/USD Market
Key Levels:
Resistance levels: $0.50, $0.55, $0.60
Support levels: $0.90, $0.85, $0.80
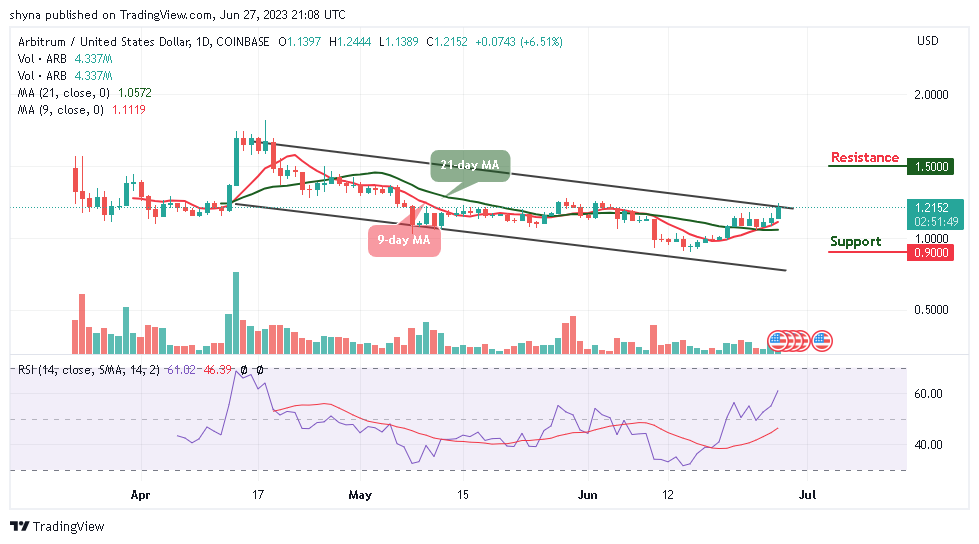
ARB/USD begins a fresh increase from the $1.138 support zone as the price continues to rise above the 9-day and 21-day moving averages; it is likely for the crypto to accelerate higher if it breaks above the upper boundary of the channel.
Arbitrum Price Prediction: How Far Can ARB/USD Go?
At the moment, the Arbitrum price is trading at $1.21 after adding 6.51% to its value on the day. The strength of the coin is opening the door for a massive recovery movement targeting $1.30. Meanwhile, from a technical perspective, ARB/USD is capable of tackling the hurdles toward the upside as the Relative Strength Index (14) moves to cross above the 60-level.
Nonetheless, it seems like the bulls may aim for a clear break above the $0.25 and $0.30 levels in the coming sessions. If they are successful with the break, the resistance levels of 1.50, $1.55, and $1.60 may come into play. In the event a reversal ensues, traders could be alert for critical support levels at $0.90, $0.85, and $0.0.80 respectively.
Against Bitcoin, the Arbitrum price heads toward the upside as the coin trades at 396 SAT and expects another break above the upper boundary of the channel. Looking at the daily chart, traders can see that the bulls are dominating the market and the next resistance level may come at 480 SAT and below.
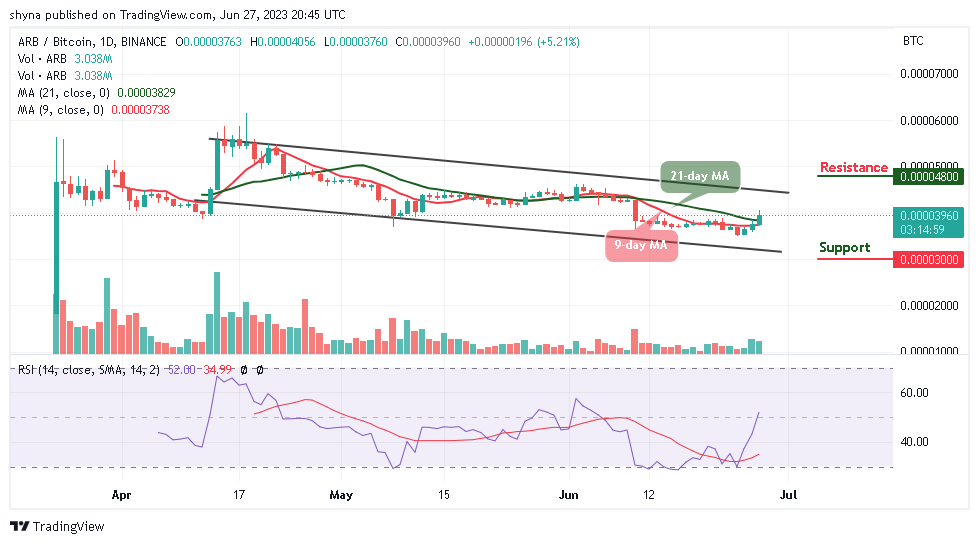
Meanwhile, on the downside, a possible bearish movement could bring the market below the 9-day and 21-day moving averages which could touch the support level at 300 SAT and above. However, the technical indicator Relative Strength Index (14) reveals that the signal line crosses above the 50-level, which could trigger more bullish signals in the market.
Arbitrum Alternatives
According to the daily chart, with the confirmation of the technical indicators, the Arbitrum price is going to create additional bullish trends as the Relative Strength Index (14) is moving above the 60-level, warming up for additional bullish signals.
Meanwhile, the Wall Street Memes group has more than a million members, who are more than happy to back this new project. This is a clear advantage of $WSM over other meme coins and serves as a clear indication of its future potential. However, during the ongoing presale, the token has raised close to $10 million as interested investors are expected to invest in the coin before the expiration of the presale.
Read more:
- Litecoin Price Prediction: LTC/USD May Fall Below $110; Bears Seem to Increase Volume
- Ethereum Transaction Fee Falls to 49-Day Lows
New OKX Listing - Wall Street Memes

- Established Community of Stocks & Crypto Traders
- Featured on Cointelegraph, CoinMarketCap, Yahoo Finance
- Rated Best Crypto to Buy Now In Meme Coin Sector
- Team Behind OpenSea NFT Collection - Wall St Bulls
- Tweets Replied to by Elon Musk
Join Our Telegram channel to stay up to date on breaking news coverage