
Join Our Telegram channel to stay up to date on breaking news coverage
The Amp price prediction may lack short-term and medium-term support, but if the price rises further, the coin is likely to face the upside.
Amp Prediction Statistics Data:
- Amp price now – $0.0049
- Amp market cap – $206.7 million
- Amp circulating supply – 42.2 billion
- Amp total supply – 99.2 billion
- Amp Coinmarketcap ranking – #148
AMP/USD Market
Key Levels:
Resistance levels: $0.0070, $0.0075, $0.0080
Support levels: $0.0020, $0.0015, $0.0010
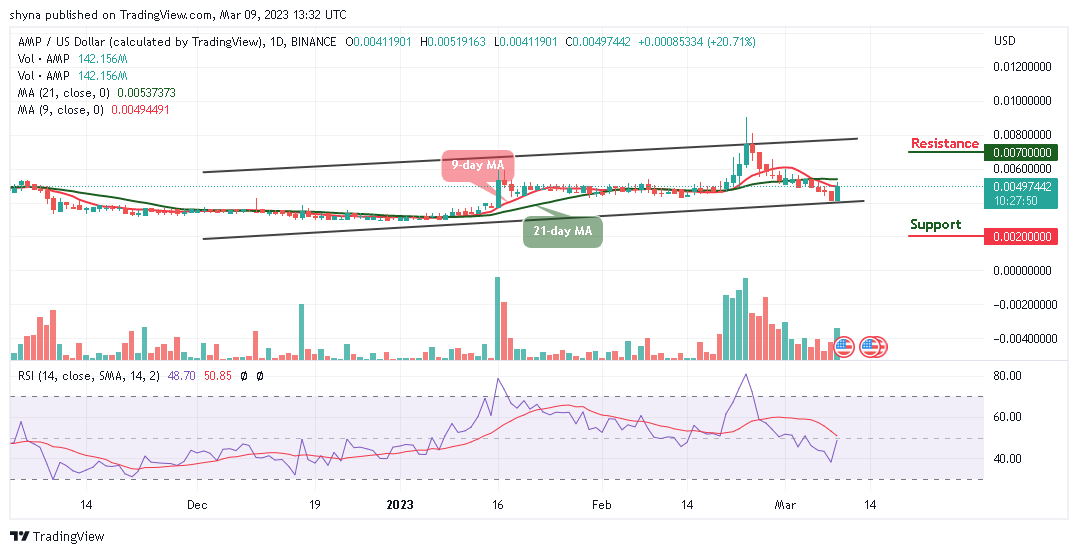
AMP/USD is currently trading around the $0.0049 level aiming to cross above the 9-day and 21-day moving averages. In the range of the ascending channel, the closest resistance could be located at $0.0055, with a close resistance at $0.0060. Meanwhile, if the market increases, additional resistance can be found heading toward the upper boundary of the channel.
Amp Price Prediction: Amp (AMP) May Go Bullish
According to the daily chart, it is obvious that the Amp price may likely create more bullish trends once the sideways movement fades away, and this is noticeable for the technical indicator Relative Strength Index (14) as the signal line moves to cross above the 50-level.
At the time of writing, the Amp market keeps rebounding from the daily low of $0.0041; meanwhile, any bearish movement below the daily low could lead the coin to a serious downtrend below the lower boundary of the channel. However, the support levels for the coin may be located at $0.0020, $0.0015, and $0.0010, while the resistance levels lie at $0.0070, $0.0065, and $0.0060 respectively.
Against Bitcoin, the support level of this range is built around 20 SAT. The resistance is set at 24 SAT because the market price is still hovering within the 9-day and 21-day moving averages. Technically, the price may continue to follow the bullish movement in the next positive direction as the technical indicator Relative Strength Index (14) crosses above the 50-level.
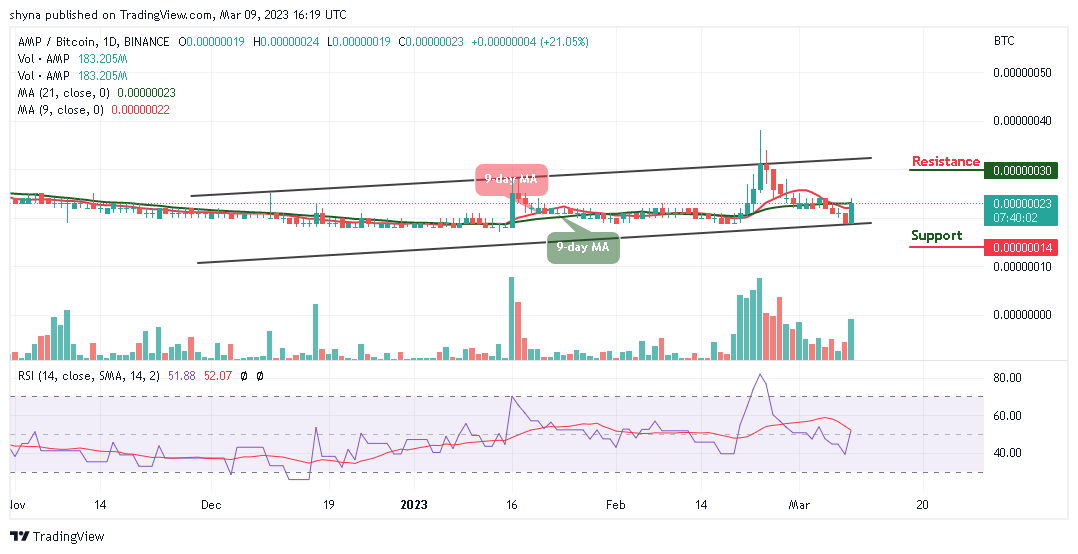
However, if the Amp price slides below the lower boundary of the channel, AMP/BTC could hit the support level at 14 SAT and below. Moreover, any bullish movement toward the upper boundary of the channel may allow the market to form a new upward trend and could reach the potential resistance at 30 SAT and above.
Amp Alternatives
The Amp price may continue with the bullish movement after touching the daily high of $0.0051 during the European session today. The coin is now heading toward the upper boundary of the channel to continue the bullish movement. However, the FightOut token presale has recently commenced while the project has been witnessing impressive traction from users and the investor community. The token has proven to be one of the most promising cryptos after effectively filling the gaps in the move-to-earn industry to provide a customer-centric approach as almost $5.5m has been made in the presale.
Join Our Telegram channel to stay up to date on breaking news coverage