
Join Our Telegram channel to stay up to date on breaking news coverage
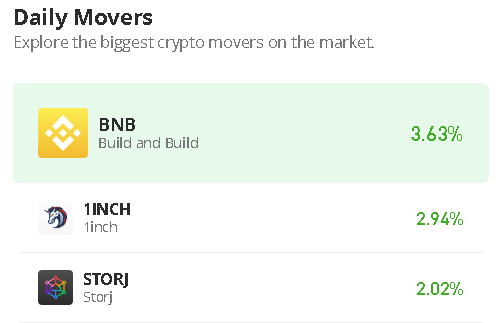
The 1inch price prediction shows that 1INCH is facing the upside as the coin moves to break above the upper boundary of the channel.
1inch Prediction Statistics Data:
- 1inch price now – $0.51
- 1inch market cap – $417.5 million
- 1inch circulating supply – 815 million
- 1inch total supply – 1.5 billion
- 1inch Coinmarketcap ranking – #95
1INCH/USD Market
Key Levels:
Resistance levels: $0.65, $0.70, $0.75
Support levels: $0.40, $0.35, $0.30
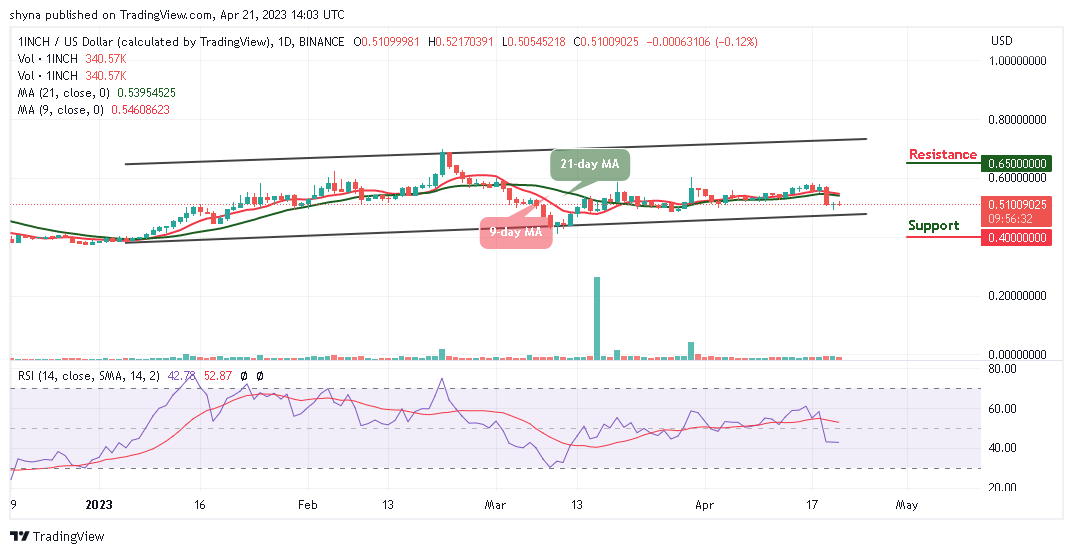
1INCH/USD is moving to cross above the 9-day and 21-day moving averages to begin the bullish movement. According to the daily chart, the 1inch price is likely to shoot to the upside while the technical indicator Relative Strength Index (14) remains below the 50-level. However, the market is projecting a volatile movement where the 1inch price may continue to follow the sideways movement.
1inch Price Prediction: 1inch Price Aims at the Upside
As the daily chart reveals, the 1inch price touches the daily high at $0.52 today for it to cross above the 9-day and 21-day moving averages. Meanwhile, any bearish cross below the lower boundary of the channel may bring the price to the support levels of $0.40, $0.35, and $0.30.
However, considering a bullish movement for this coin, 1INCH/USD may spike toward the upper boundary of the channel to hit the potential resistance levels of $0.65, $0.70, and 0.75 in the long-term bullish. Nevertheless, the technical indicator Relative Strength Index (14) is moving in the same direction above the 40-level, suggesting a sideways movement for the market.
Against Bitcoin, the 1inch price is likely to cross above the 9-day and 21-day moving averages where the price is expected to break to the upside. However, should the price succeed, it may continue an upward trend which could touch the potential resistance level at 2400 SAT and above.
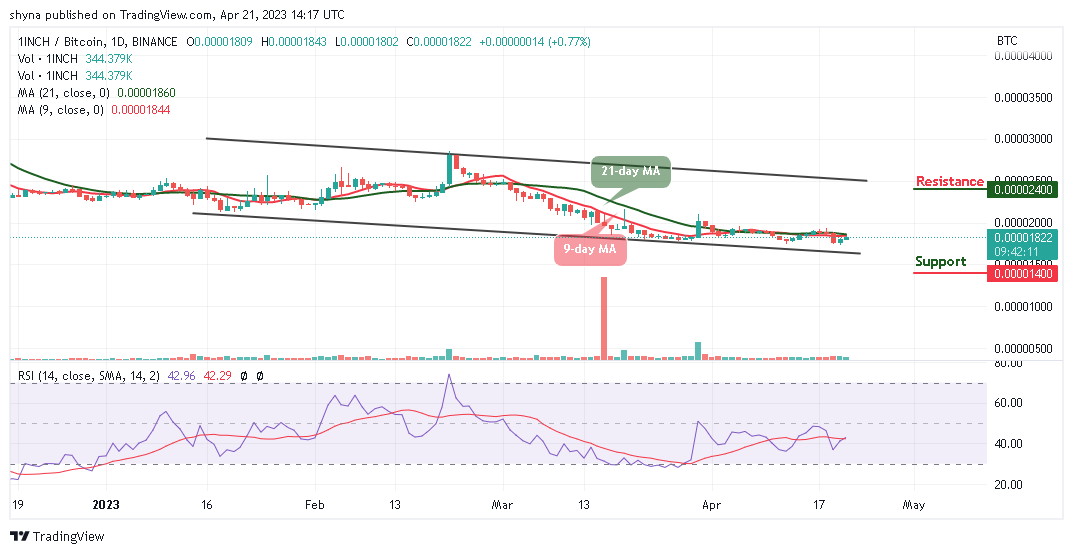
In other words, if the 1INCH price slides and crosses below the lower boundary of the channel, it is expected to locate the support at 1400 SAT and below. Moreover, the technical indicator Relative Strength Index (14) moves toward the 50-level which reveals that the 1inch price may continue to move to the upside.
1inch Alternatives
According to the daily chart, the 1Inch price is likely to shoot to the upside while the technical indicator Relative Strength Index (14) remains below the 50-level. However, the market is projecting a volatile movement where it could follow the bullish movement. Meanwhile, whatever you’re into, whether it’s politics, entertainment, or social issues, Love Hate Inu ensures you have the chance to voice your opinion and find a supportive community. LHINU has the potential to be the next big crypto. Through the presale, the token’s price will increase, paving the way for new exchange listings as almost $5.5m has been raised so far.
Join Our Telegram channel to stay up to date on breaking news coverage