
Join Our Telegram channel to stay up to date on breaking news coverage
Ethereum is facing renewed pressure as heavy Ethereum ETF outflows signal fading institutional appetite, adding to an already fragile market structure. With ETH breaking below recent lows and momentum indicators still bearish, can buyers step in before downside risks deepen further?
ETH Key Statistics
- Current Price: $2,637
- Market Cap: $319 billion
- Trading Volume (24h): $33 billion
- Circulating Supply: 120 million ETH
- Total Supply: 120 million ETH
- CoinMarketCap Ranking: #2
Ethereum’s price performance has been markedly bearish, plunging 21.88% from its monthly peak and 12.66% from its weekly high. Unlike other assets showing slight recoveries, ETH has failed to find a floor and is currently trading 4.06% below its previously established minimum for the period. This breakdown below recent lows signals intense selling pressure and a lack of immediate buyer interest at these levels.
ETH/USD Market
Key Levels
- Support levels: $2600, $2,500, $2,400
- Resistance levels: $2,800, $3,000, $3,110
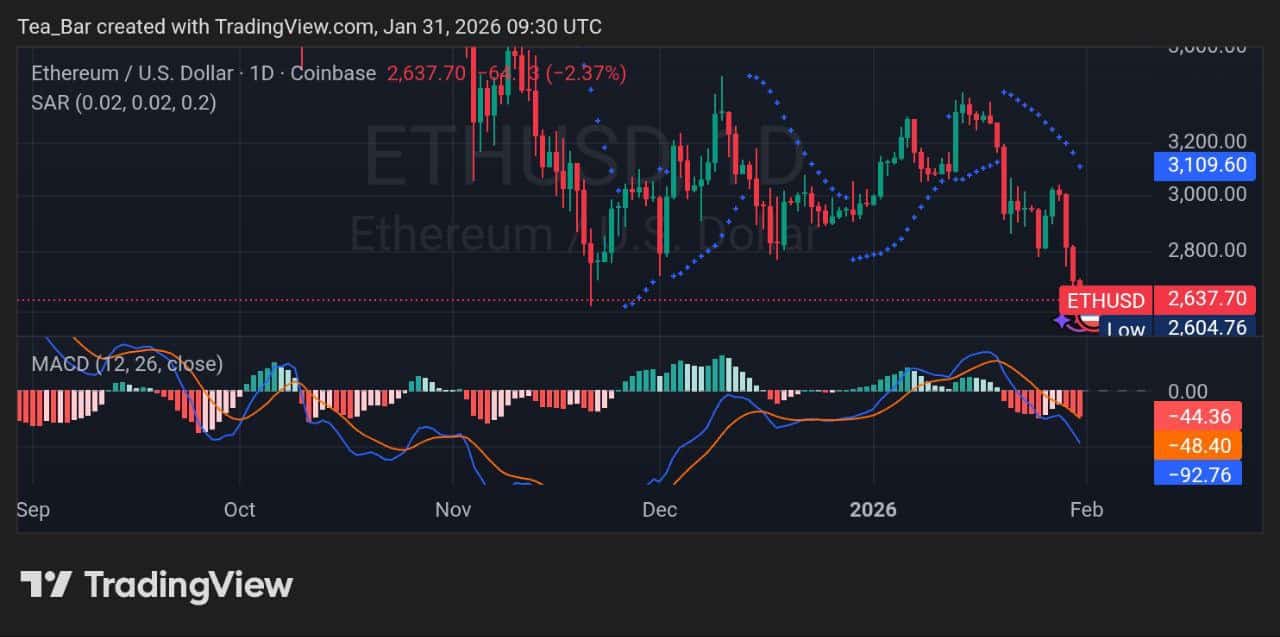
The ETHUSD daily chart displays a pronounced downtrend from late 2025 highs near $3,200, with price accelerating lower in January 2026 to a recent low of $2,604.76 before a minor stabilization attempt, currently trading at $2,637.70 (9:30 UTC) after a -2.37% daily decline. The Parabolic SAR dots are positioned firmly above the candles, reinforcing bearish trend dominance, while the MACD histogram remains deeply negative at -44.36 with the MACD line below the signal line and no immediate crossover in sight, signaling sustained selling pressure and limited bullish conviction in the near term.
If ETHUSD manages to hold above the recent swing low and shows signs of reversal with MACD curling toward zero, it could challenge resistance at $2,800 initially, followed by $3,000 and potentially $3,110 on stronger momentum. However, if downside pressure resumes and price breaks below $2,604, it is likely to test lower supports at $2,600 and then $2,500, potentially extending the correction toward deeper levels as long as SAR stays above price and MACD remains bearish; resistances are identified at $2,800, $3,000, and $3,110, with supports at $2,600, $2,500, and $2,400.
ETH/BTC Range-Bound with Weakening Bearish Pressure
ETH/BTC on the daily chart trades at 0.03183 (-0.93%), remaining in a prolonged consolidation range between roughly 0.0309 and 0.0338 after the broader decline from late 2025 highs near 0.0415. The Parabolic SAR (0.02, 0.02, 0.2) continues to sit above price at approximately 0.0338, reinforcing overhead resistance and maintaining a bearish bias, though the SAR dots have flattened and clustered closer to price in recent weeks.

MACD lingers in negative territory at around -0.000017 with histogram bars showing only minimal expansion and the lines essentially flat near the signal, indicating very low momentum in either direction and a lack of strong conviction from sellers or buyers. Price has formed a series of higher lows since the bottom near 0.0309, suggesting gradual accumulation and potential seller exhaustion within this tight range.
Significant Ethereum ETF Outflows Signals Short-Term Pressure
According to on-chain analyst TedPillows in an X update, U.S. spot Ethereum ETFs experienced a substantial net outflow of $252.9 million on the previous day, with BlackRock’s iShares Ethereum Trust (ETHA) alone accounting for sales amounting to $157.2 million worth of Ethereum.
$ETH ETF outflow of $252,900,000 🔴 yesterday.
BlackRock sold $157,200,000 in Ethereum. pic.twitter.com/r1wGnRmtdk
— Ted (@TedPillows) January 31, 2026
The notable Ethereum ETF outflows (part of a broader pattern of recent selling pressure amid volatile market conditions and shifting investor sentiment) implies potential downward pressure on Ethereum’s price in the near term, as institutional capital exits could weigh on sentiment and liquidity, even as longer-term fundamentals like network upgrades and adoption trends remain supportive for recovery.
Could Ethereum’s 2026 Path Finally Outrun Its Familiar Challenges?
Ethereum’s outlook through 2026 will largely depend on whether upcoming protocol upgrades—most notably the Fusaka improvements—can meaningfully enhance scalability and efficiency while the network simultaneously manages the growing threat of staking centralization. With the Altcoin Season Index holding steady at a neutral 27, ETH continues to trade more as a foundational technology investment than a momentum-driven altcoin play, though macro headwinds still cloud short-term sentiment.
Ethereum (ETH) Elliott Wave Update
Regulatory developments remain a wildcard: a positive SEC ruling on staking-enabled ETFs around March 15 could unlock substantial institutional inflows and reinforce whale conviction. Ultimately, the decisive factor boils down to one core tension—can Ethereum’s technical progress and potential policy tailwinds deliver enough upside to overcome persistent delays in ETF momentum and broader market hesitation?
Related News
- Ethereum Price Holds Steady Around $2,908 As Bitmine Adds Another 40,302 ETH
-
Ethereum Foundation Launches Dedicated Team to Tackle Quantum Threats
Best Wallet - Diversify Your Crypto Portfolio

- Easy to Use, Feature-Driven Crypto Wallet
- Get Early Access to Upcoming Token ICOs
- Multi-Chain, Multi-Wallet, Non-Custodial
- Now On App Store, Google Play
- 250,000+ Monthly Active Users
Join Our Telegram channel to stay up to date on breaking news coverage
