Join Our Telegram channel to stay up to date on breaking news coverage
The Polkadot price prediction reveals that DOT is trading around $2.11, having experienced a sharp recovery from the lower boundary of the descending channel.
Polkadot Prediction Data:
- Polkadot price now – $2.11
- Polkadot market cap – $3.58 billion
- Polkadot circulating supply – 1.65 billion
- Polkadot total supply – 1.65 billion
- Polkadot CoinMarketCap ranking – #31
Polkadot (DOT) has experienced significant volatility since its launch, but it’s still an asset to watch for long-term potential. Trading within a 24-hour range of $2.09 to $2.17, DOT is far from its all-time high of $55.00, reached in November 2021, reflecting a steep decline of over 96%. However, from its all-time low of $1.41 in October 2025, the token has risen by about 54%, highlighting that despite setbacks, DOT continues to show recovery potential. For early investors, especially those who saw its first-ever listing, the massive rise from the all-time low demonstrates how long-term holding and patience can lead to significant returns, even through market fluctuations.
DOT/USD Market
Key Levels:
Resistance levels: $2.80, $3.00, $3.20
Support levels: $1.50, $1.30, $1.10

From a technical standpoint, DOT/USD is currently attempting to push past resistance levels near $2.15 and $2.30, with $2.80 serving as a crucial resistance point. A sustained move above these levels would indicate increased buying pressure, confirming that the recovery could extend toward the next resistance at $3.00 and $3.20. If DOT can maintain momentum and close above the $2.80 resistance, it could open the door for a broader trend reversal, pushing the price toward even higher targets in the medium term. Traders should keep an eye on volume, as an increase in buying interest could signal further upside potential.
Polkadot Price Prediction: DOT Keeps Testing the Key Support Zone
However, if the Polkadot price fails to break above the short-term resistance and encounters rejection at these levels, DOT/USD may revisit the lower boundary of the descending channel, potentially testing support near $1.50. A breakdown below this support would open the door for further downside pressure, with potential targets at $1.30 and $1.10. Given the current market structure, any failure to maintain bullish momentum above $2.00 could signal a return to consolidation, with the market testing lower levels before a possible reversal.
Polkadot (DOT) Reality Check
Despite the recent recovery, Polkadot’s overall market structure is still in a critical phase. The key challenge for the bulls is to defend the $2.00–$2.20 support zone and push the price higher. If they succeed, it could pave the way for a mid-channel recovery, allowing for a more sustained rally. If, however, bears regain control and price breaks below support, the market could face further consolidation or extended downside risks. Polkadot (DOT) is at a pivotal point, and the next few days will be crucial for determining the direction of the market. With volume dynamics and candle behavior playing a key role, a confirmed breakout above resistance levels could signal a renewed bullish trend, while failure to maintain upward pressure could lead to a more prolonged consolidation phase. Monitoring these levels will be essential for traders looking to capitalize on the next big move in DOT.
DOT/BTC Eyes Key Resistance Amidst Short-Term Bullish Momentum
Polkadot (DOT/BTC) is currently trading around 2271 SAT after a sharp upward move, testing the key resistance level at 2800 SAT. The price has recently broken above the 9-day moving average, signaling a potential short-term bullish shift. Although it remains slightly below the 21-day moving average, the price action suggests that buyers are regaining control after the extended downtrend. The volume increase is also indicative of growing interest, signaling that DOT/BTC could be gearing up for further upside if it can break through the resistance near 2500 SAT and maintain momentum.
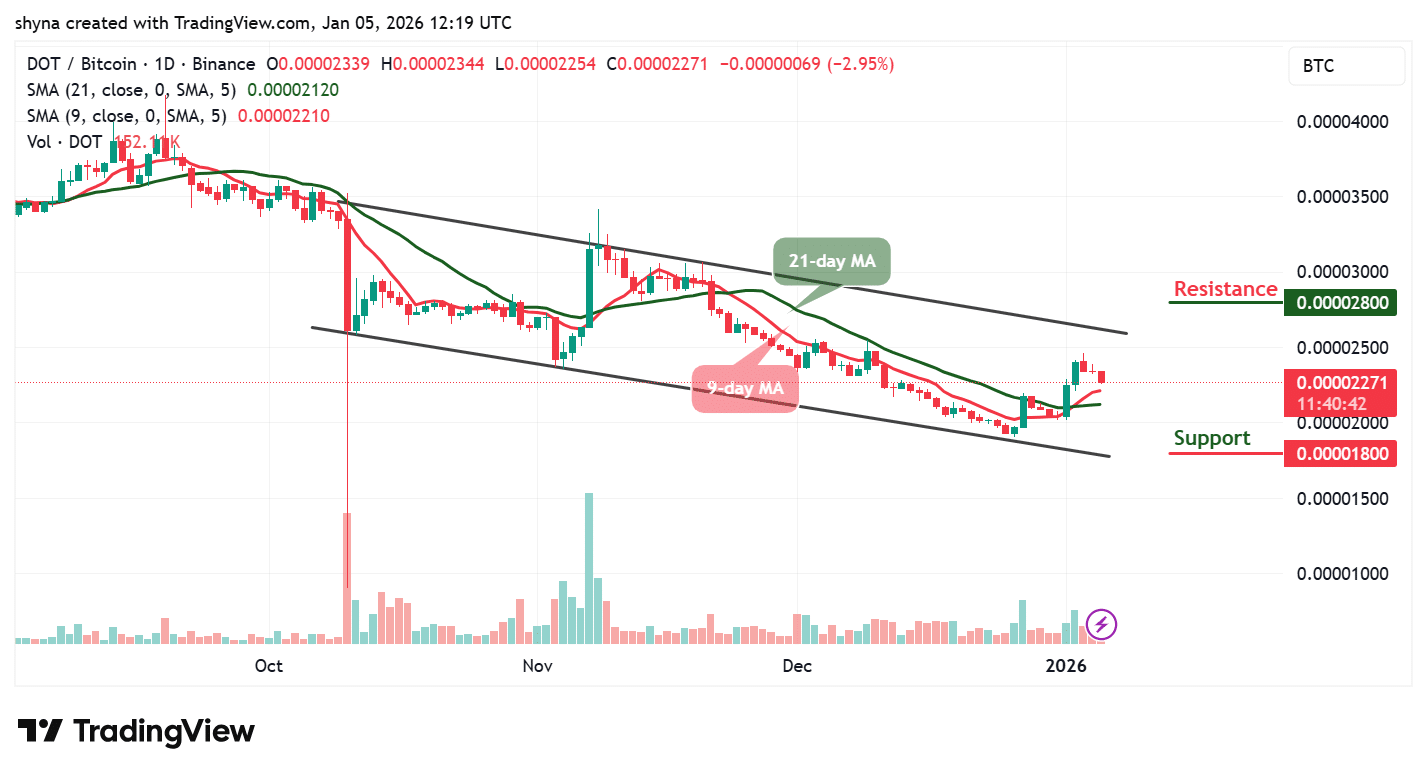
From a technical perspective, Polkadot is now approaching a crucial test of the upper boundary of the descending channel, which aligns with the resistance at 3,000 SAT. A clean breakout above this level would likely open the path for a continued rally, with the next key targets being 2800 SAT and possibly 3000 SAT. If the price fails to hold above the current level and encounters rejection at this resistance, it could retest support near 1900 SAT. A failure to hold support at this level would likely signal a return to the broader bearish trend. Traders should monitor the volume closely as a sign of strength or weakness in the upcoming days.
Meanwhile, @AltCryptoGems shared with his followers on X (formerly Twitter) that the $DOT chart is undeniably disappointing, having dropped nearly 97% from its highs and fallen back below its 2020 low. He asked his followers whether they believe $DOT will ever recover from this steep decline.
This is definitely a depressing chart, almost down 97% from the highs and back below its 2020 low.
What do you think, will $DOT ever recover again? pic.twitter.com/GgPvYgI43G
— Sjuul | AltCryptoGems (@AltCryptoGems) January 2, 2026
Nonetheless, Polkadot is a leading multi-chain blockchain platform designed to facilitate interoperability between different blockchains, enabling cross-chain communication and shared security. DOT remains a critical asset in the ecosystem, driving decentralized governance and innovation across various blockchain projects. The price has recently surpassed both the 9-day and 21-day moving averages, signaling early signs of bullish strength, with buyers beginning to defend the support region. While the broader trend remains bearish, the recent move above the 9-day moving average reflects a cautious short-term recovery, suggesting that Polkadot could be preparing for a potential rally toward the upper boundary of the channel.
Related News
- Leading DeFi Tokens By Market Activity Today – Chainlink, Polkadot, Sky, Cosmos
- Top Crypto to Invest in Right Now, July 19 – Avalanche, Aave, Polkadot
Best Wallet - Diversify Your Crypto Portfolio

- Easy to Use, Feature-Driven Crypto Wallet
- Get Early Access to Upcoming Token ICOs
- Multi-Chain, Multi-Wallet, Non-Custodial
- Now On App Store, Google Play
- 250,000+ Monthly Active Users
Join Our Telegram channel to stay up to date on breaking news coverage