Join Our Telegram channel to stay up to date on breaking news coverage
The Bitcoin price prediction revisits the resistance level of $30,000 as the king coin targets a $31,000 high.
Bitcoin Prediction Statistics Data:
- Bitcoin price now – $30,386
- Bitcoin market cap – $578.6 billion
- Bitcoin circulating supply – 19.0 million
- Bitcoin total supply – 19.0 million
- Bitcoin Coinmarketcap ranking – #1
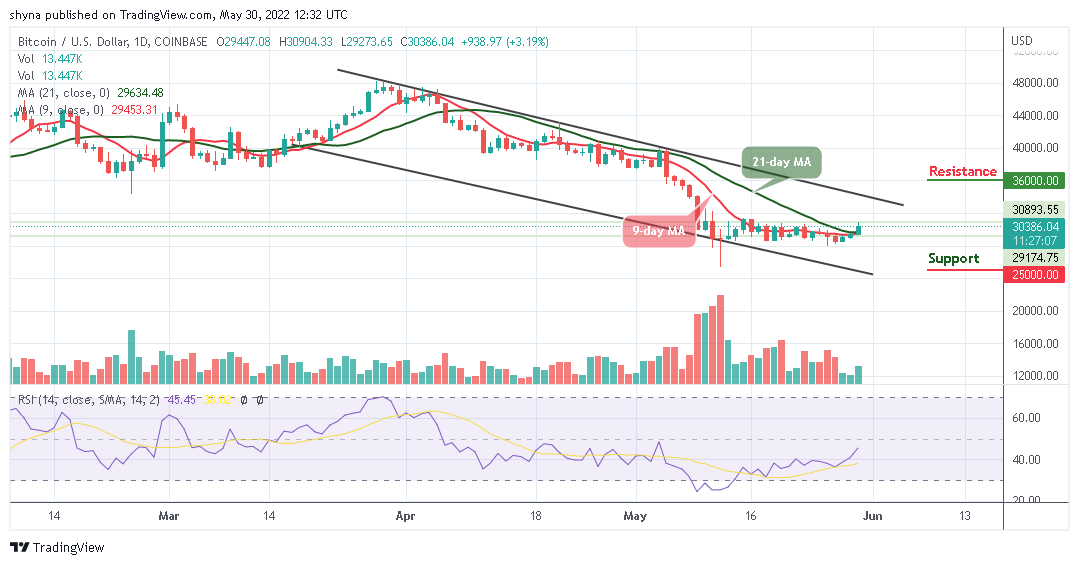
BTC/USD Long-term Trend: Bearish (Daily Chart)
Key levels:
Resistance Levels: $36,000, $38,000, $40,000
Support Levels: $25,000, $23,000, $21,000
BTC/USD is recovering towards the upside as the first digital asset crosses above the resistance level of $30,000. For the past few days, the Bitcoin price has been facing the upside to the extent of crossing above the 9-day and 21-day moving averages.
Bitcoin Price Prediction: Would BTC Shoot to the Upside?
At the time of writing, traders could see that the Bitcoin price is trying to recover from its opening price of $29,447. However, the 9-day MA trend-line is likely to cross above the 21-day MA as they prepare to focus on the upside. In addition, the technical indicator Relative Strength Index (14) is moving to cross above 50-level in an attempt to probably cross into the upside.
Moreover, a clear break above the resistance level of $30,500 could set the pace for a larger increase to $36,000, $38,000, and $40,000 resistance levels. Meanwhile, should the Bitcoin price fail to stay above the resistance level of $30,000, it may continue a new decline towards the lower boundary of the channel. Therefore, if there is a downside break below this barrier, the price could hit the support levels of $25,000, $23,000, and $21,000.
BTC/USD Medium-Term Trend: Ranging (4H Chart)
According to the 4-hour chart, BTC/USD is moving sideways as the market is currently showing a sign of a bullish movement. However, following the recent rebound at $30,235 which is now a key support level, the king coin is expected to stay above this level. Meanwhile, any bearish movement below the 9-day and 21-day moving averages could locate the support level at $29,500 and below.
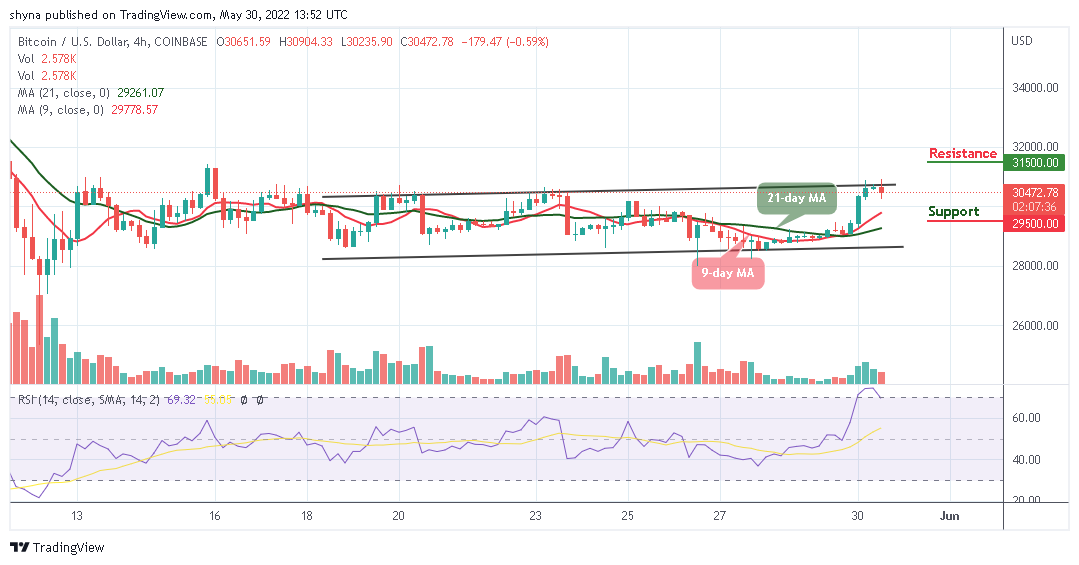
However, considering the recent sharp rebound, the Bitcoin price may continue the bullish movement to $31,000 resistance. A climb above the upper boundary of the channel may further push the BTC price to the resistance level of $31,500 and above. As it appeared now, it seems the bulls may return to the market as the Relative Strength Index (14) remains within the overbought region.
Read more:
- How to buy Bitcoin
- How to buy Cryptocurrency
Join Our Telegram channel to stay up to date on breaking news coverage