Join Our Telegram channel to stay up to date on breaking news coverage
The crypto market has just come out of a very successful Q1/23 with Bitcoin producing the best monthly close in 10 months. The global crypto market cap has held above the $1 trillion mark for the better part of 2023, even after the U.S. banking crisis threatened to take the cryptos back into the bear market conditions. Solana price has held above a crucial support line as traders wait for a breakout.
It is worth noting that SOL almost shed its entire value in 2022 following the demise of the FTX crypto exchange and its crypto hedging company Alameda Research. Things have so far turned around for the Layer 1 token in 2023 as it trades 106% above its January 1 opening of around $20.64. This is the highest year-to-date (YTD) gain recorded by a top crypto, performing even better than Bitcoin.

Actually, January was the best perming month for Solana since it traded around $50 in August. SOL climbed as much as 142% in January as it rode on the positive sentiments that resulted in price increases across the board.
Note that Solana was massively oversold in December, which may have moved late investors to buy the dip, occasioning the recovery in January.
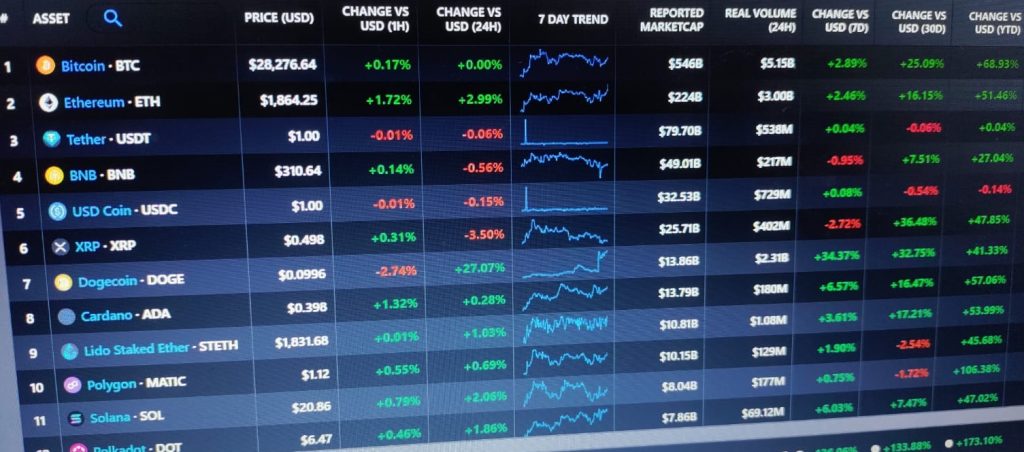
At the time of writing, Solana is hovering around $20.64 after rising 1.53% in the last 24 hours and a 24-hour trading volume of $390 million, which has spiked 31.89% on the day. With a market cap of $8.01 billion, Solana is positioned at #10 being Polygon (MATIC) on the CoinMarketCap ranking.
Where next SOL?
Solana Bulls May Exploit A Bullish Triangle To $44
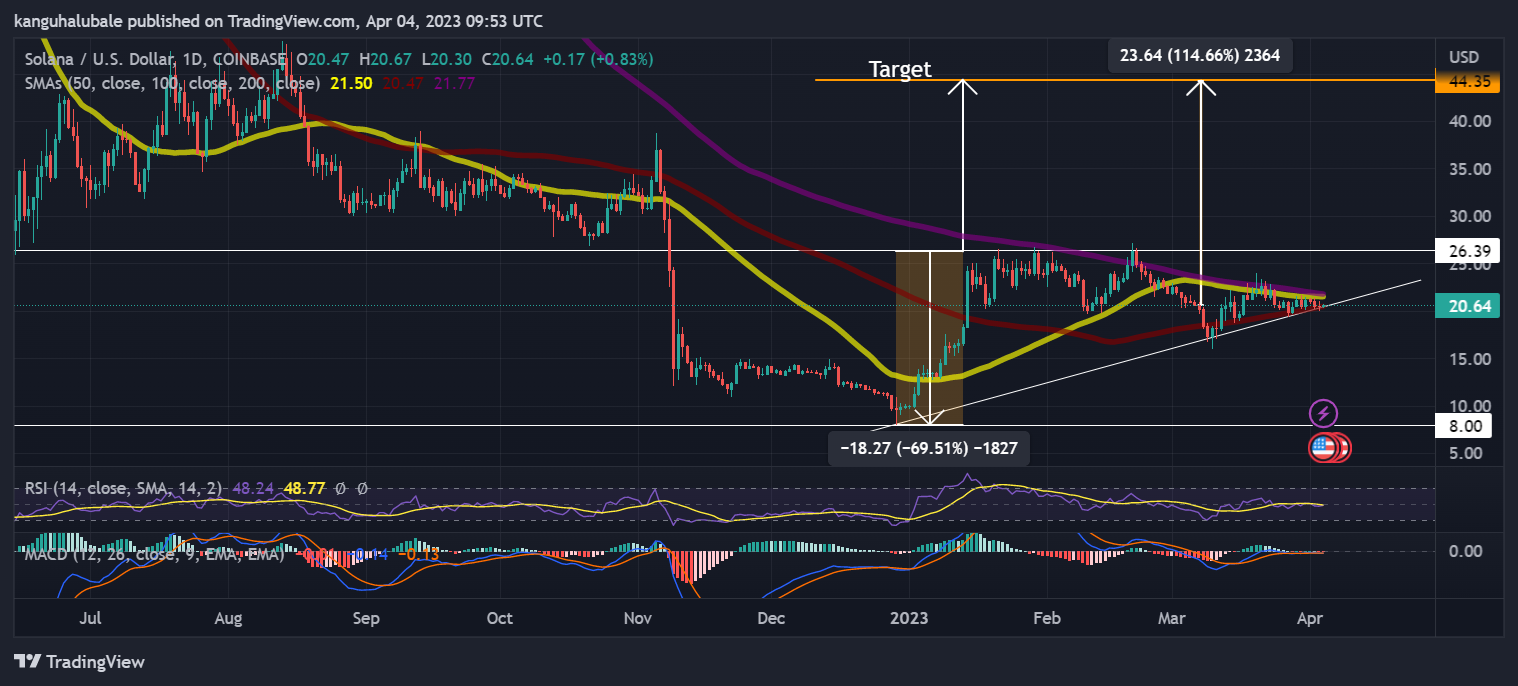
The SOL price action in 2023 has led to the appearance of an ascending triangle on the daily chart (see below). With its price currently suppressed by two major moving averages, Solana was moving downwards as investors waited to join the market at discounted rates.
On the other hand, the bulls eyed a 114% ascent to the $44.35 level, which would only be attainable if the price maintained above the ascending trendline.
To realize their goal, SOL would have to first overcome the stiff barrier at $21.6, embraced by both the 50-day Simple Moving Average (SMA) and the 200-day SMA. Beyond that, the buyers would be required to push the altcoin above the triangle’s resistance line at $26.39, confirming a bullish breakout from the technical formation.
Such a move would clear the path for a rise toward the technical target of the prevailing chart pattern at the $44.35 level. Such a move would signify a 114.66% increase from the current level.
SOL/USD Daily Chart

Solana’s positive narrative was supported by a number of indicators, starting with the upward-moving 100-day SMA at $20.47 which provided immediate support for the smart contract’s token. This showed more buyers were coming into the market. If the token price continued to move above the trendline and the 100-day SMA, the 50-day SMA and the 200-day SMA could soon produce a “golden cross” – a call a buy signal that occurs when the fast-moving SMA crosses above the slow-moving SMA.
Also bolstering the positive thesis was that the price was sitting on solid support downward. The ascending trendline, and 100-day SMA at $17.48, were all potential bases for bulls to regroup and refresh their buying power.
The Relative Strength Index (RSI) and the Moving Average Convergence Divergence (MACD) indicator were tipping upward, close to the zero line. This showed that the market was turning bullish as more buyers came back to the scene.
On the downside, if selling pressure intensifies, the price could plunge below the ascending trendline and the 100-day SMA at $20.5. In extremely bearish cases, it could lose the support offered by the SMAs and move to retest the $8.0 swing low.
Notice both the RSI and the MACD were positioned in the negative region, and this, combined with the fading histograms, showed bulls were slightly fewer than the bears.
Alternatives To Solana
As market participants are waiting to see the direction Solana takes before placing their bets, it would be good to look at new projects in presale. This is a good opportunity to diversify your crypto portfolio as such projects are known to have a low risk/reward ratio.
Such a project is Love Hate Inu (LHINU), a new meme coin sensational that is favored to be one of the best performers in 2023 after its listed in exchanges. The meme coin that doubles as a vote-to-earn (V2E) platform will give people that chance to vote on the most interesting and pressing topics from around the world.
#LoveHateInu is the best voting token, everyone.👑📈💰
Engage in trending topics and earn rewards like never before.🔥👀
Get your hands on $LHINU!🚀💰
Don’t wait until it’s too late, join the #Presale today!🌟💪https://t.co/Pu2Bo8WOUy#CryptoCommunity #AltCoins #MemeCoins
— Love Hate Inu (@LoveHateInu) April 4, 2023
The white paper for this new crypto is quite impressive too. They are really thinking ahead with some of the steps and procedures they have put in place. Voters must stake LHINU for 30 days before they will be allowed to vote which will protect the polls integrity as well as the voters anonymity. They will also sell 90% of the allocated LHINU during presale to ensure the coin has a future way beyond its CEX listings launch.
While the project is in the early stages of the presale, it has already raised more than $2.6 million with only 5 days left before the current stage of the presale ends and price increases.
Visit Love Hate Inu here for more details on how to participate in the presale.
Related News:
- ETH Price Prediction: ETH Ascending Triangle Pattern and Resistance Challenges. Can ETH still Break above the $1850 Resistance Zone?
- Best Crypto to Buy Now
Join Our Telegram channel to stay up to date on breaking news coverage


