Join Our Telegram channel to stay up to date on breaking news coverage
Litecoin Price Prediction – February 24
According to the daily, the Litecoin price prediction shows that LTC is yet to climb above $110 level as the price touches $91.52 low.
LTC/USD Market
Key Levels:
Resistance levels: $150, $170, $190
Support levels: $55, $35, $15

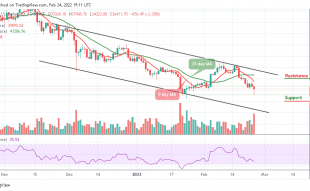
LTC/USD is currently struggling to rebound from the daily low of $91.52 as the coin prepares to cross above the 9-day moving average. Meanwhile, the nearest key level of support remains at $90, but if the coin breakdown with a daily candle closes below this level, it may likely slump below the lower boundary of the channel.
Litecoin Price Prediction: Litecoin (LTC) Faces the Downside
According to the daily chart, the Litecoin price stays below the 9-day and 21-day moving averages, if the market price remains below this barrier, it can experience a period of bearish momentum and it could target the nearest support level at $80 before crossing below the lower boundary of the channel to hit the support levels of $55, $35, and $15.
However, if the Litecoin (LTC) breaks above the moving averages, it may likely face a bullish movement towards the upper boundary of the channel. Should in case the price decides to maintain the bullish movement, the coin may find the potential resistance levels at $150, $170, and $190 as the technical indicator Relative Strength Index (14) suggests a sideways movement below 40-level.
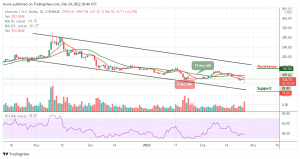
When compared with Bitcoin, the Litecoin price follows a bearish sentiment and it may continue to trade below the 9-day and 21-day moving averages. Should in case the bulls try to halt the current movement, the bears may continue to release a huge pressure on the market as the technical indicator Relative Strength Index (14) is ready to cross into the oversold region, to give more bearish signals.

Moreover, if the Litecoin price faces the lower boundary of the channel, it could hit the nearest support at 2500 SAT. Any further negative movement may lower the price to 2200 SAT and below. In case of a rebound, the coin can revisit the 3200 SAT above the channel before resuming the rally which could see a bull-run to the resistance level of 3400 SAT and above.
Looking to buy or trade Litecoin (LTC) now? Invest at eToro!
68% of retail investor accounts lose money when trading CFDs with this provider
Join Our Telegram channel to stay up to date on breaking news coverage