Join Our Telegram channel to stay up to date on breaking news coverage
XRP Price Prediction – November 2
For the past few days, Ripple (XRP) has been unable to develop the upside momentum above $0.24.
XRP/USD Market
Key Levels:
Resistance levels: $0.26, $0.27, $0.29
Support levels: $0.22, $0.21, $0.20
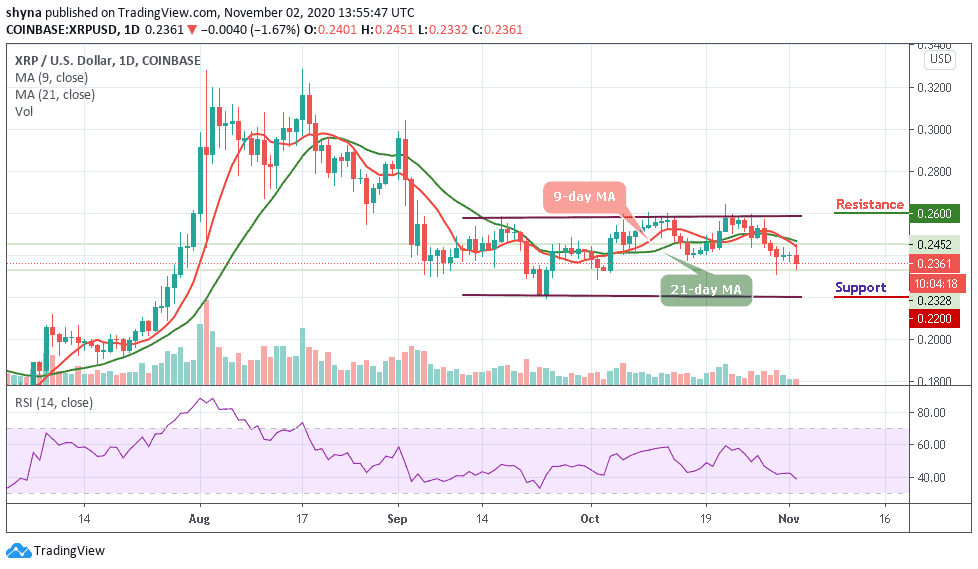
XRP/USD touches the area above $0.24 at the opening of the market today, but failed to hold the ground and retreated quickly towards $0.23 by the time of writing. Nevertheless, the Ripple (XRP) has stayed mostly unchanged both on a day-to-day basis and since the beginning of today. XRP/USD now remains at a tight range that limited its bullish movements since October 23.
What is the Next Direction for Ripple?
However, should the bulls manage to push the market above the moving averages; they may soon find the resistance at $0.26, $0.27, and $0.29 levels. Meanwhile, if the market continues to experience the bearish movement, it may likely hit the nearest support at $0.22 and a further drop could pull the market to $0.21 and $0.20 supports. The technical indicator RSI (14) for XRP/USD is slowly moving below the 40-level, suggesting more bearish signals into the market.
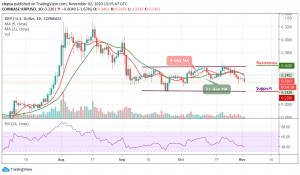
Against Bitcoin, XRP is still trading on the downside, although the price action has remained intact below the 9-day and 21-day moving averages. Meanwhile, if the selling pressure persists, the Ripple price variation may likely create a new low in the next coming trading days.
For now, the technical indicator RSI (14) is seen moving within the oversold region; traders may continue to see a negative move in the market soon they can as well expect close support at the 1700 SAT by breaking below the channel to hit the critical support of 1550 SAT and below. If a bullish move occurs and validates a break significantly above the 9-day moving average; traders may confirm a bull-run for the market and the closest resistance levels lie at the 1950 SAT and above.
Read more:
- USDCAD May Reach $1.2977 Level
- Ripple Labs Completes $50 Million Investment in MoneyGram
- Cardano Price Prediction: ADA Could Drop Below $0.40 Support
Join Our Telegram channel to stay up to date on breaking news coverage