Join Our Telegram channel to stay up to date on breaking news coverage
Binance Coin Price Prediction – July 30
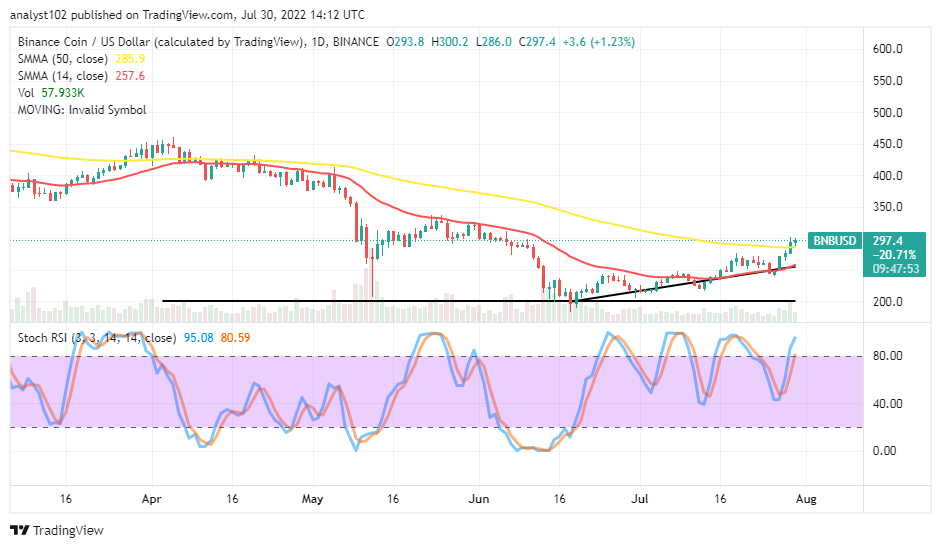
The Binance Coin market activity heightens forces in a rallying motion to outpace the market worth of the US Dollar. Price has been trading between $213.67 and $301.21 value lines over the last thirty days. The crypto economy is around $297 at a positive percentage of 1.23.
Binance Coin Price Statistics:
BNB price now – $297.71
BNB market cap – $48 billion
BNB circulating supply – 163.3 million
BNB total supply – 163.3 million
Coinmarketcap ranking – #5
Binance Coin Market
Key Levels:
Resistance levels: $320, $350, $380
Support levels: $250, $220, $190 BNB /USD – Daily Chart
The BNB/USD daily chart showcases the crypto-economic market heightens forces against the valuation of the US fiat currency. The featuring of series candlesticks has formed to break past the SMA trend lines recently. The 14-day SMA indicator is $257, beneath the 50-day SMA indicator, which is at $285.9. The bullish trend line drew closely around the trend line of the smaller SMA to depict the bottom path from where the price has been able to swing upward. The Stochastic Oscillators have briefly moved into the overbought region.
Will the BNB/USD trade push upward higher furthermore?
It’s noteworthy to observe the pace at which the BNB/USD trade pushes n a rallying manner as the crypto-economic price heightens forces. As of writing, the price has pushed northward slightly past the value of the 50-day SMA. But, jumping into the market to ride along the impulse may in no time cause a bull trap. Therefore, opened buy positions that might have taken may allow running until a significant sell signal emanates afterward.
On the downside of the technical analysis, the BNB/USD market bears are to be cautious of exerting a new selling order for a while as the momentum to the upside over the trend line of the 50-day SMA has not had a significant signal to back up an early occurrence of declining mode. Therefore, the need to wait cautiously for a convergence trading pattern over the trend line of the bigger SMA before getting a decent sell entry.
BNB/BTC Price Analysis
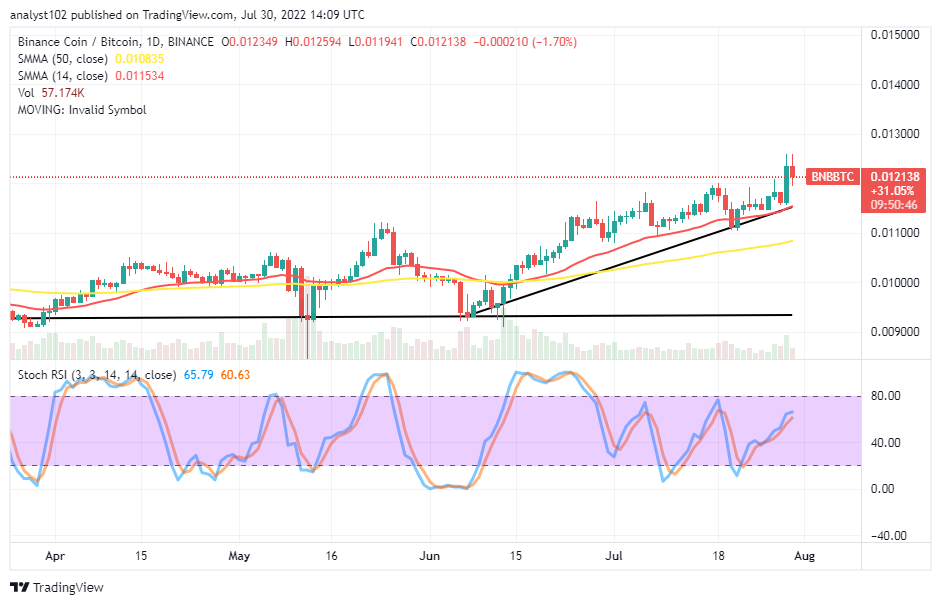
In comparison, the Binance Coin market has continually held positions higher against Bitcoin above the trend lines of the SMAs. The 14-day SMA indicator is above the 50-day SMA indicator. The Stochastic Oscillators are slantingly positioned northbound from the range of 20, pointing to the upside closely below the range of 80. In the meantime, a bearish candlestick has featured to warn against executing new buying orders to indicate the base crypto may soon be going down for a while, pairing with its counter-trading tool.
Read more:
Join Our Telegram channel to stay up to date on breaking news coverage


