Join Our Telegram channel to stay up to date on breaking news coverage
The Ethereum price prediction reveals that ETH needs to pull above the $1500 resistance level quickly to deny the bears to enter the market.
Ethereum Prediction Statistics Data:
- Ethereum price now – $1,246
- Ethereum market cap – $151.4 billion
- Ethereum circulating supply – 121.4 million
- Ethereum total supply – 121.4 million
- Ethereum Coinmarketcap ranking – #2
ETH/USD Market
Key Levels:
Resistance levels: $2000, $2200, $2400
Support levels: $40, $300, $200
ETH/USD is hovering around $1246 as the coin prepares to gain more bullish signals. The movement to the upside has not allowed the market to bow to the selling activity under $1100 during the European session today. At the moment, the Ethereum price is trading above the 9-day and 21-day moving averages.
Ethereum Price Prediction: Would ETH Price Move Above $1500?
At the time of writing, the Ethereum price heads to the upside as the coin hits the daily high at $1275. Looking at the daily chart, the $1000 remains to be a key support zone and if it is broken, the sell-off may be extended towards the $800 support level. Currently, the price of the coin is changing hands at the $1,246 level, and the bulls are beginning to make effort.
In other words, any reversal towards the lower boundary of the channel may welcome the bears back into the market and the price could meet the critical supports at $400, $300, and $200. More so, the technical indicator Relative Strength Index (14) is moving to cross above the 50-level which indicates the continuation of the bullish trends and further resistance could be found at the $2000, $2200, and $2400 levels.
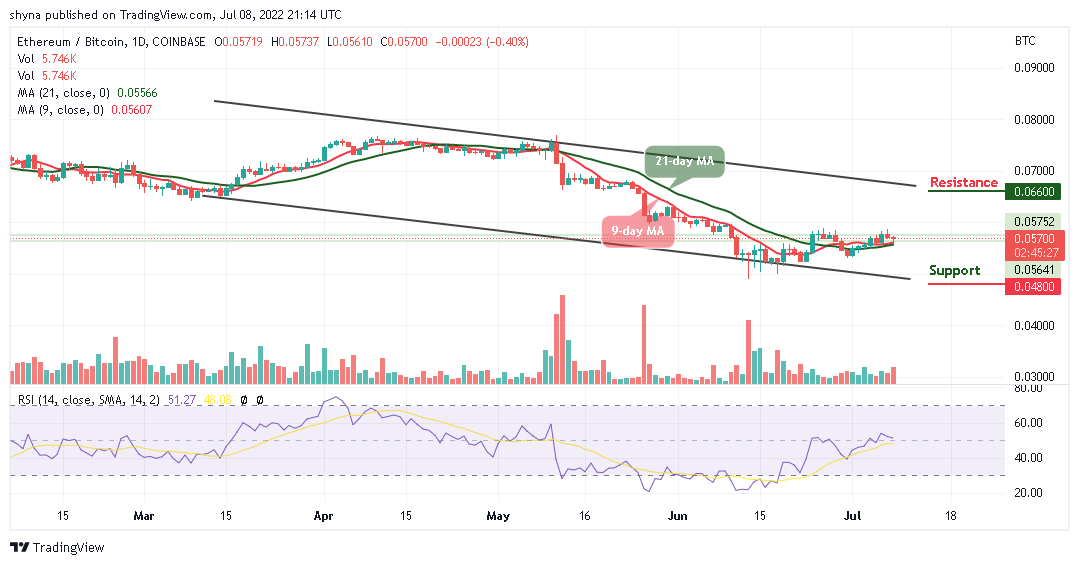
Against BTC, the daily chart shows that the Ethereum price is following the downtrend. If the price stays above the 9-day and 21-day moving averages, there is a possibility of a bullish movement in the long term. If the price begins to rise, it could break the 6600 SAT and above in future sessions.

Meanwhile, if the bears regroup now, the bearish cross below the lower boundary of the channel may play out before touching the support level of 4800 SAT and below. At the moment, the daily outlook is still ranging as the Relative Strength Index (14) moves above 50-level.
Join Our Telegram channel to stay up to date on breaking news coverage


