Join Our Telegram channel to stay up to date on breaking news coverage
BCH Price Prediction – October 29
Bitcoin Cash buyers defend $260 support, which results in a shallow recovery above $265.
BCH/USD Market
Key Levels:
Resistance levels: $295, $305, $315
Support levels: $240, $230, $220

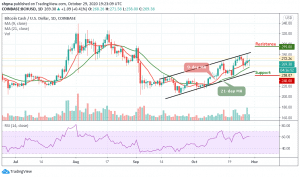
BCH/USD is seen shifting its focus towards the resistance level of $280 after clearing the $268 level. A few days ago, the market was extremely down below the 9-day moving average. At the time of writing, Bitcoin Cash is creating a new bullish trend and trading at $269.38 within the ascending channel.
What to Expect from Bitcoin Cash (BCH)
Peradventure the market drives below the 9-day and 21-day moving averages, the BCH price may likely slump to the initial support at $250, which may later bring the price to its critical supports at $240, $230, and $220. But presently, the signal line of RSI (14) moves above the 60-level and this could increase the buying pressure as the price may cross above the upper boundary of the channel to reach the $285 resistance.
Nevertheless, while trading at $285, a bullish continuation could touch the resistance levels of $295, $305, and $315. Therefore, if the BCH price returns to the old support and break-even, bears could take over the market. But as it stands, the bulls are coming up. Meanwhile, traders may expect a bullish chase within the market before any other reversal occurs.
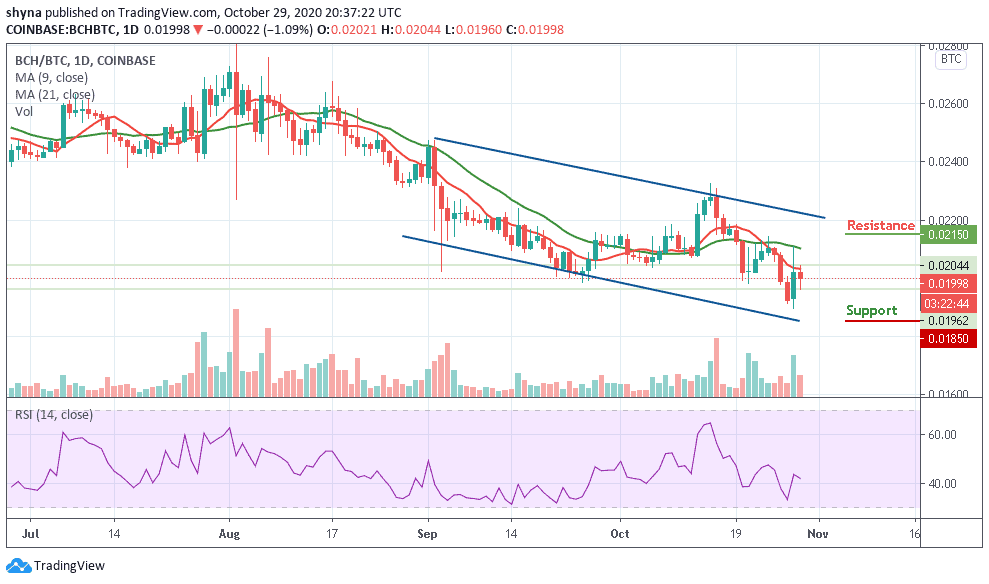
When comparing with Bitcoin, the daily chart reveals that bears are showing a greater commitment to the trading as they keep pushing the price towards the south. However, following the recent bearish trends, the downward movement may continue in as much as the buyers failed to push the price above the 9-day and 21-day moving averages.

However, the technical indicator RSI (14) is seen trading below the 44-level which may cause the coin to continue the downtrend. Moreover, any further bearish movement could drag the coin to the support levels of 0.0185 BTC and below while a push above the moving averages could hit the potential resistance of 0.0215 BTC and above.
Join Our Telegram channel to stay up to date on breaking news coverage

