Join Our Telegram channel to stay up to date on breaking news coverage
BCH Price Prediction – July 21
Since yesterday, BCH/USD upsurge astounds the intraday traders as the coin indicates a breach of the immediate resistance level.
BCH/USD Market
Key Levels:
Resistance levels: $248, $268, $288
Support levels: $215, $195, $175
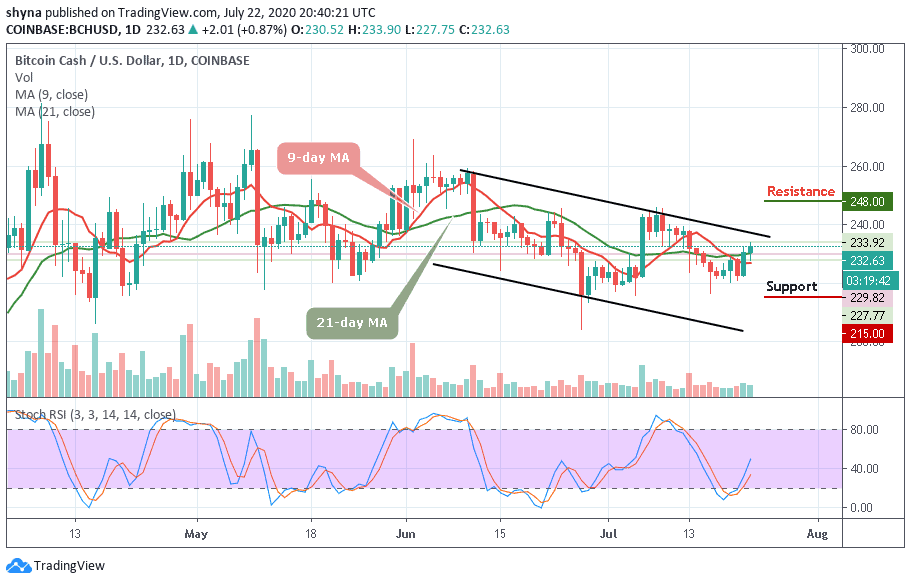
BCH/USD seems to be picked up its pace as the price movement is above $230. Following the recent price, Bitcoin Cash is currently facing a critical resistance at $233 level at the upper boundary of the channel. A break above the ascending channel is likely to produce a huge green candle to the upside, marking resistances at $248, $268, $288 levels.
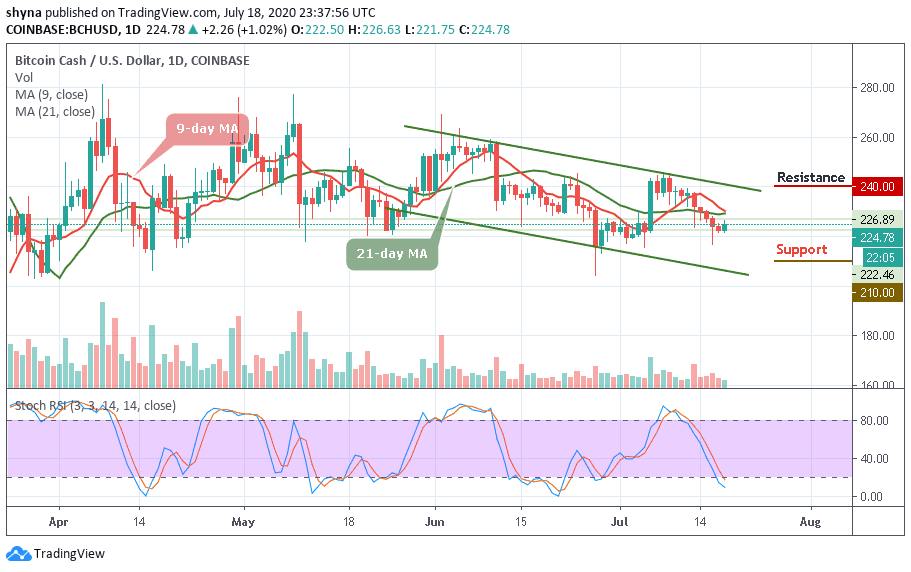
Meanwhile, the coin has been showing a strong bullish momentum since yesterday’s trading session when the coin moved from $222 to a high of $232. Before then, BCH/USD has not been able to maintain a consistent bullish run since July 8. As the 9-day MA cross below 21-day MA, a precise bear cross might reveal a sell signal for the market which may start to show signs of a downward movement.
Moreover, a bearish step back is likely to bring the market to the low of $215 support with a possible break down to $195 and $175 supports, establishing a new monthly low for the market. Looking at the chart, we can see that the trading volume is rising slowly, giving a sign of an upcoming big move.
Comparing with BTC, the Bitcoin Cash is trading around the 9-day and 21-day moving averages signaling a bullish rally, which may likely meet the potential resistance at 0.0260 BTC and 0.0265 BTC if pressure rises to cross above the upper boundary of the channel. However, the technical indicator stochastic RSI is seen moving out of the oversold zone, suggesting more bullish signals in the market.
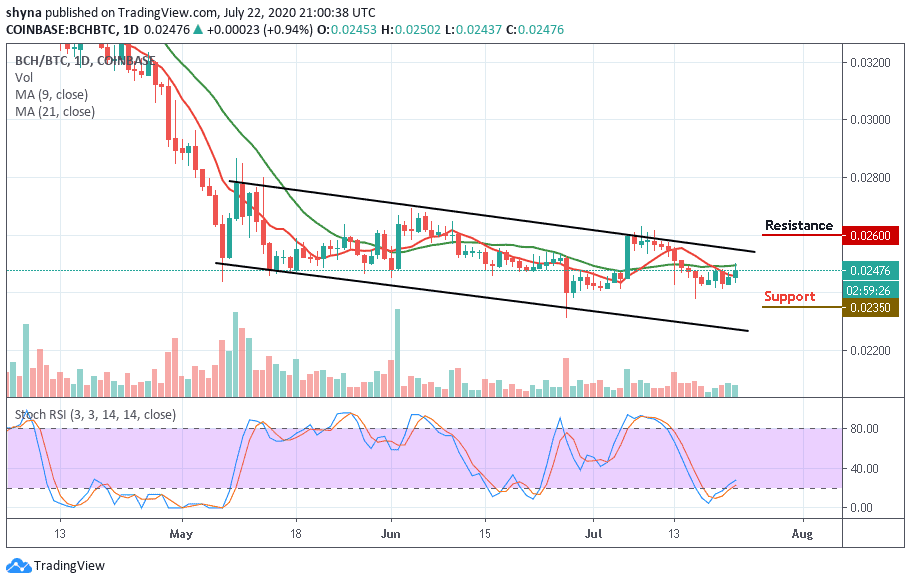
Meanwhile, should the bulls fail to push the market upward; the price could easily fall below the moving averages to 0.0240 BTC support. More so, while trading at support, a bearish continuation could touch the 0.0235 BTC and 0.0230 BTC, creating a new low towards the falling channel.
Join Our Telegram channel to stay up to date on breaking news coverage