Join Our Telegram channel to stay up to date on breaking news coverage

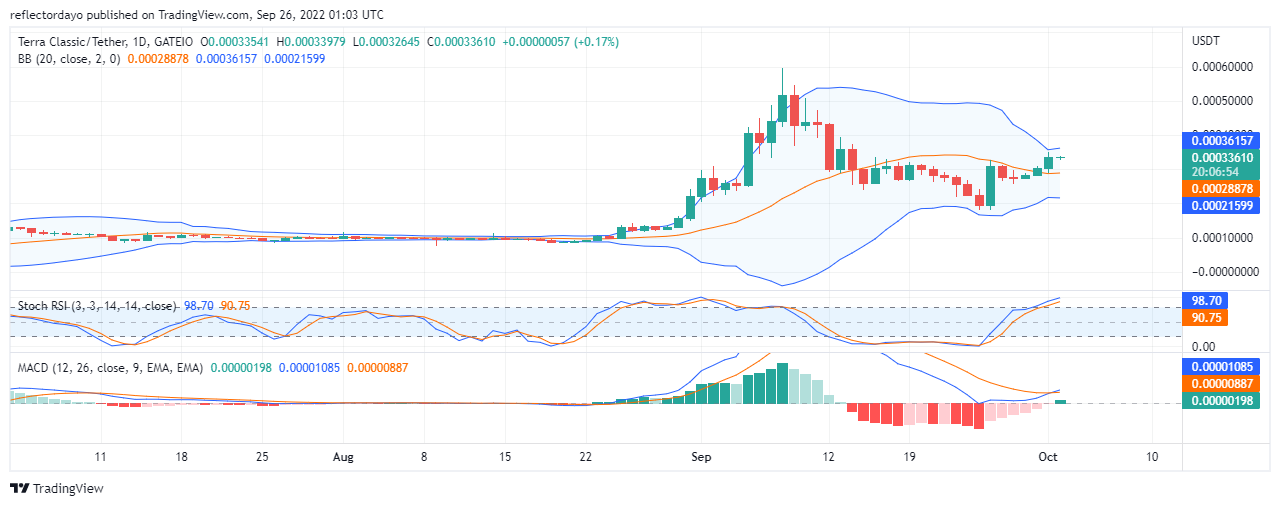
The Terra classic market on the 26th of September was very bullish. The trend reversal from the bullish market trend started on that very day. After sellers resisted the bullish market advancement between the 27th and the 28th of September, buying pressure continues to push the price upward. Now, the sellers are gaining more strength and they are slowing down the bullish advancement.
Terra Classic Market Price Statistic:
- LUNC/USD price now: $0.00033674
- LUNC/USD market cap: $2,068,199,951
- LUNC/USD circulating supply: 6,151.07Billion
- LUNC/USD total supply: 6,904,017,889,662
- LUNC/USD coin market ranking: #31
Key Levels
- Resistance: $0.0003616169, $0.000400571, $0.000500000
- Support: $0.000288880 $0.00021594 $0.000154300
Your capital is at risk
Terra Classic Market Price Analysis: The Indicators’ Point of View
As the selling pressure increases to counter the buying pressure (and their forces against each other is becoming equal) the upper and lower band of the Bollinger band is becoming compressed. However, in today’s market, buyers appear to be resilient as they hold ground against selling pressure. This struggle made the current market price linger at around $0.00033909. the result of this is that the upper and lower band of the Bollinger is
beginning to move apart again. In the RSI indicator, despite the very strong bullish move on the 26th of September, the RSI line did not go into the overbought territory. It was in yesterday’s market that it entered the overbought Territory. And now, the line is slowing down. However as bulls still have the upper hand, the line may continue to move in the overbought territory.
LUNC/USD 4-Hour Chart Outlook
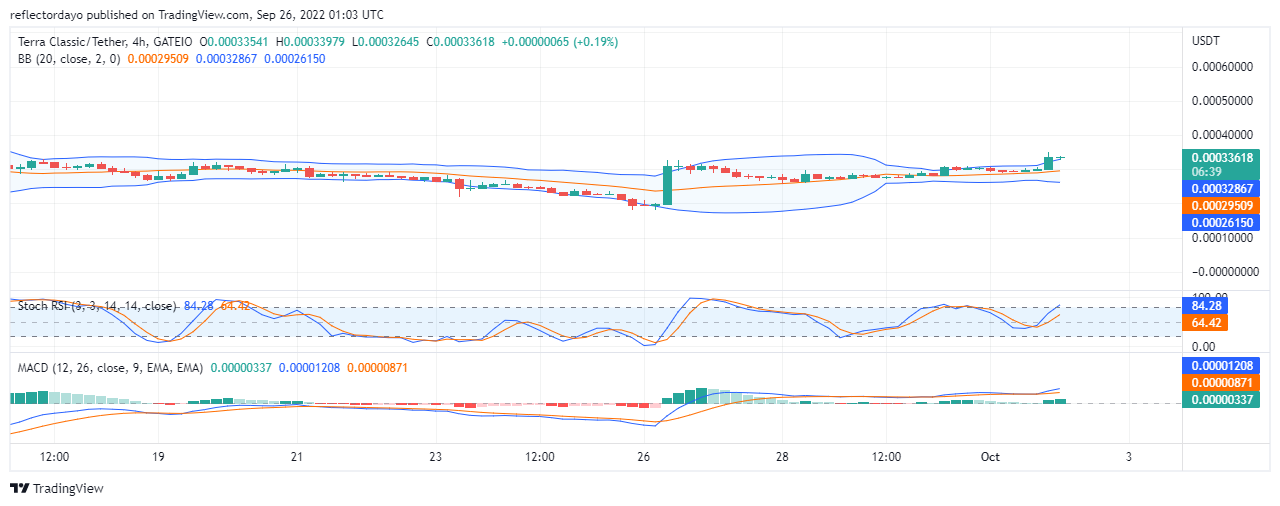
The price action is moving on the outside of the Bollinger band indicator. This is a sign of an imminent downward retracement of the price because the price action must correct itself back within the bands. Apart from this, RSI and MACD are showing strong bullish market movements. The bullish histograms of the MACD are progressive and the two lines are moving above them. This means that the market is still in an uptrend.
Join Our Telegram channel to stay up to date on breaking news coverage


