Join Our Telegram channel to stay up to date on breaking news coverage
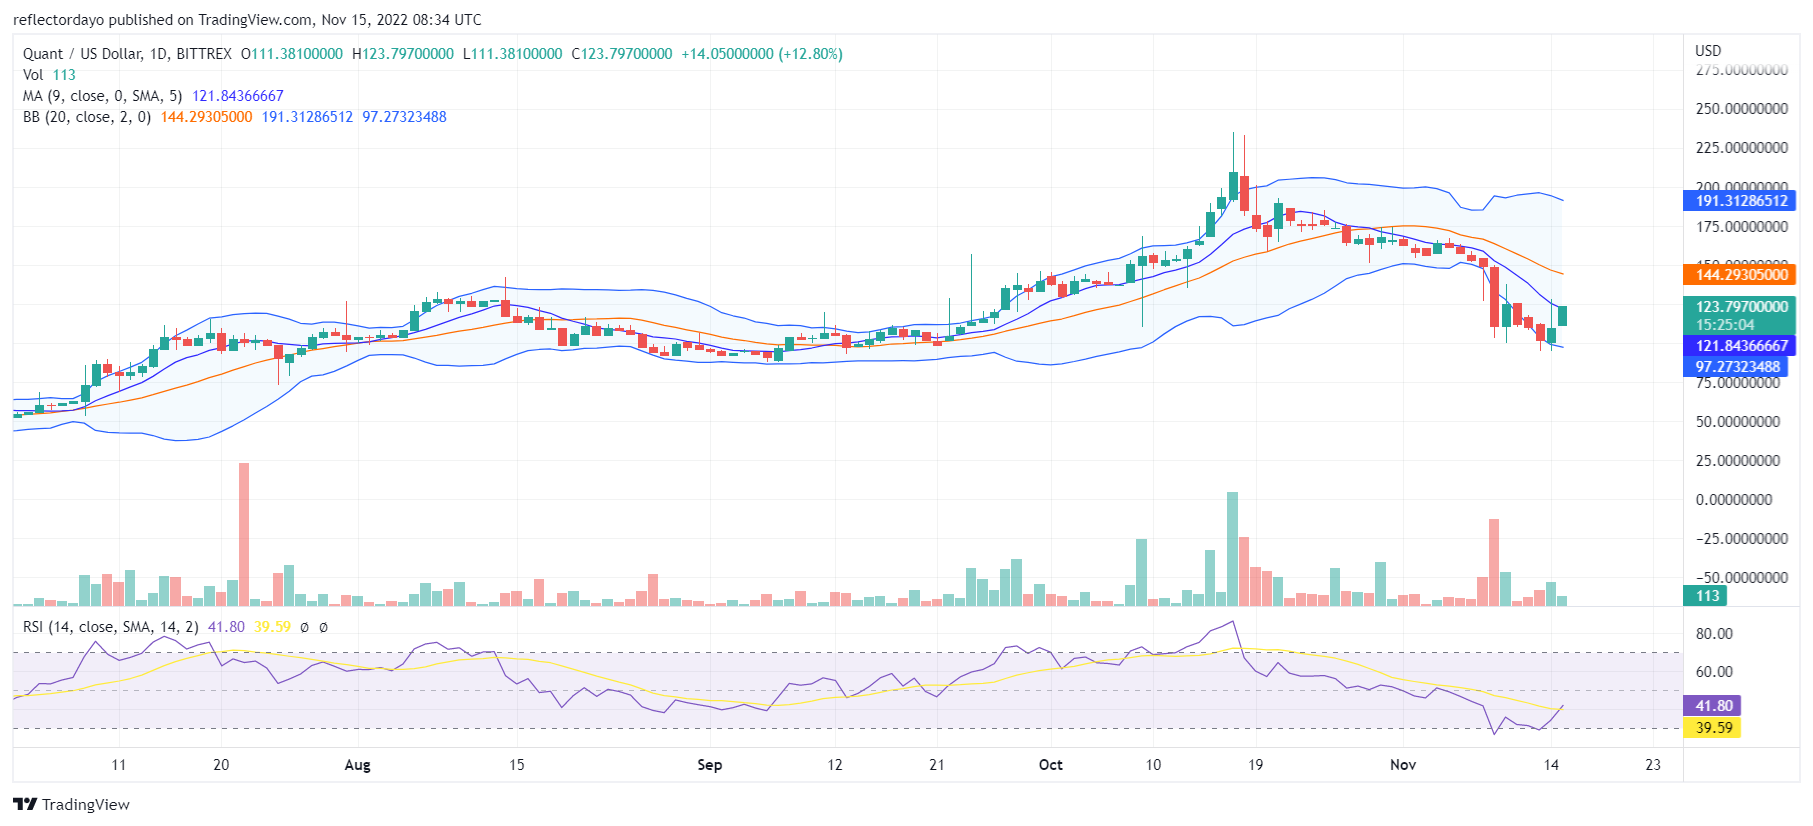
After the Quant price encountered bearish resistance at the $225 price level, the price had a steep fall below the $175 price level. Buyers needed to face another resistance at the $175 price level. This $175 level was supposed to be a new support level for the price but strong resistance pushed bulls out of this territory. Then with the narrowing price channel, the market had a price massive price breakout to the downside until they encountered the September 22 support level Which is $100.
Quant Market Price Statistic:
- QNT/USD price now: $123.8
- QNT/USD market cap: $1,420,901,478
- QNT/USD circulating supply:12,072,738.00
- QNT/USD total supply: 14,612,493
- QNT/USD coin market ranking: #32
Key Levels
- Resistance: $ 125, $140, $155
- Support: $100, $85, $70
Quant Market Price Analysis: The Indicators’ Point of View
Previously, the support was at $111, but Bull at this level could not withstand the massive selling pressure and the price fell to $100. From this level the price rallies. However, it looks like the price is facing resistance at $125. The bearish resistance shifted downward to $125. This is a potential threat for bulls at the $100 price level. A price channel of a $25 range has formed on the chart. The lower band of the Bollinger indicator is changing direction from downward movement to horizontal movement. And the upper band is changing bearing to the downside. The momentum of the bullish market remains below the midpoint in the RSI indicator. The bulls need to conquer this difficult resistance.
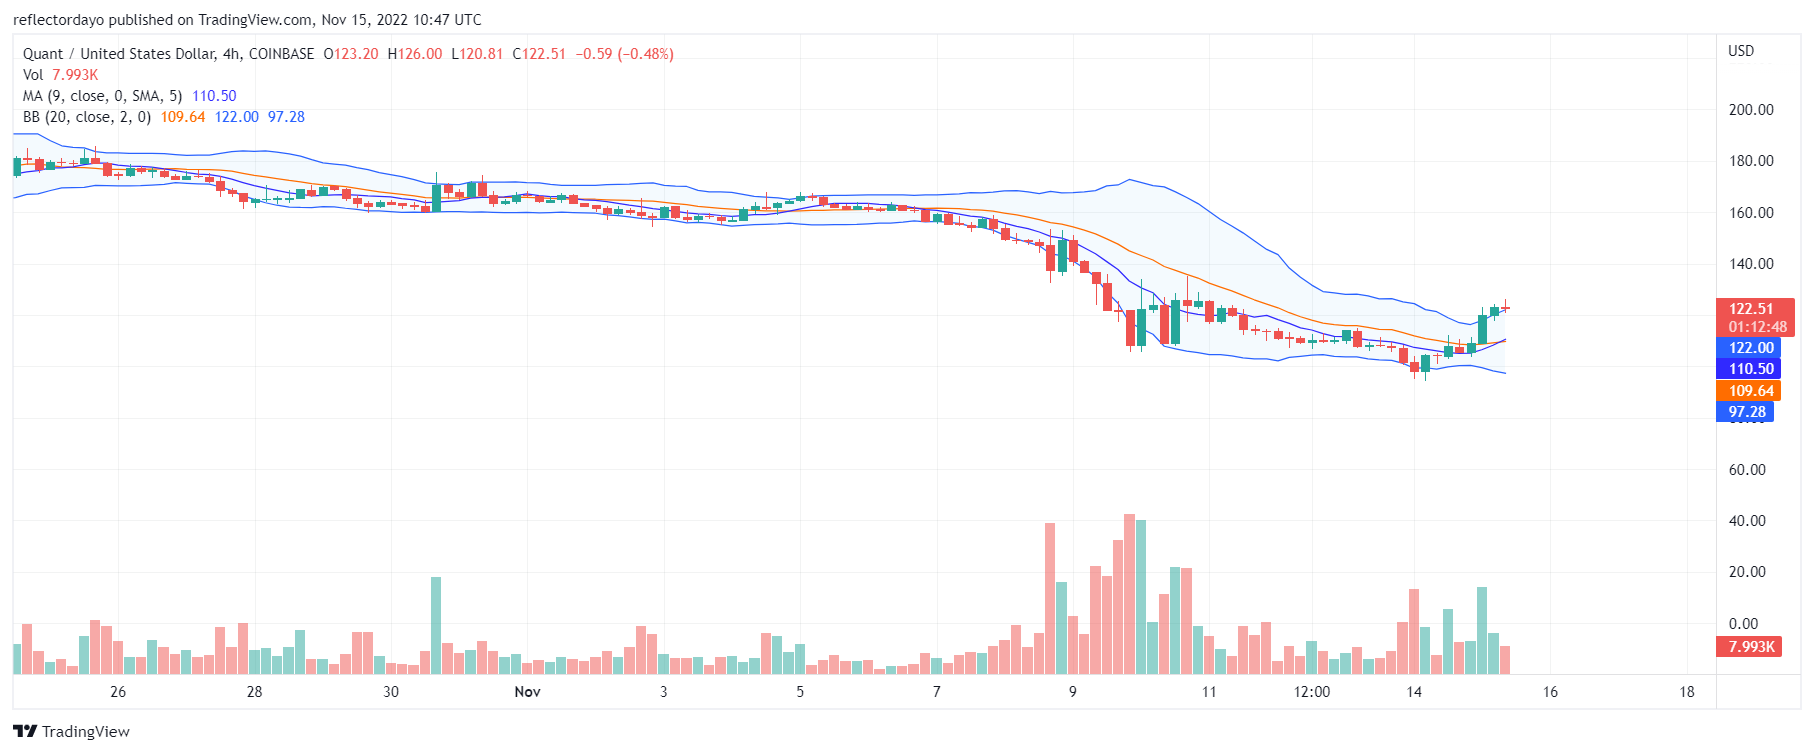
QNT/USD 4-Hour Chart Outlook
The day’s market opens with the first session being bullish. There is no sign of bearish activities seen in the market. The candle that represents the first session is known as marubozu. It has no upper or lower shadow. This type of candle portrays how strong the buying pressure was in the first session. But the second session opens at $120. This is a bit lower than the closing price of the previous session, however, the price rallies and closes at $122. The third session hasn’t shown much progress yet due to the struggle at the resistance price level area. This is because the buying pressure is still showing vigor, it is likely the bulls conquer the resistance and the price continue trending upwards.
This Is the Best Time to Buy Dash 2 Trade (D2T)
This is the perfect time to buy D2T token, and one reasons for this is because CZ of Binance has already announced an industry recovery plan for crypto projects. The ongoing Dash 2 Trade presale has raised almost $6.5 million so far.
Related
Join Our Telegram channel to stay up to date on breaking news coverage