Join Our Telegram channel to stay up to date on breaking news coverage
Litecoin (LTC) Price Prediction – November 6
Litecoin adds a tremendous 7.33% gain in a day, and at the time of writing, it is trading around the $63.37 resistance level.
LTC/USD Market
Key Levels:
Resistance levels: $68, $70, $72
Support levels: $55, $53, $51
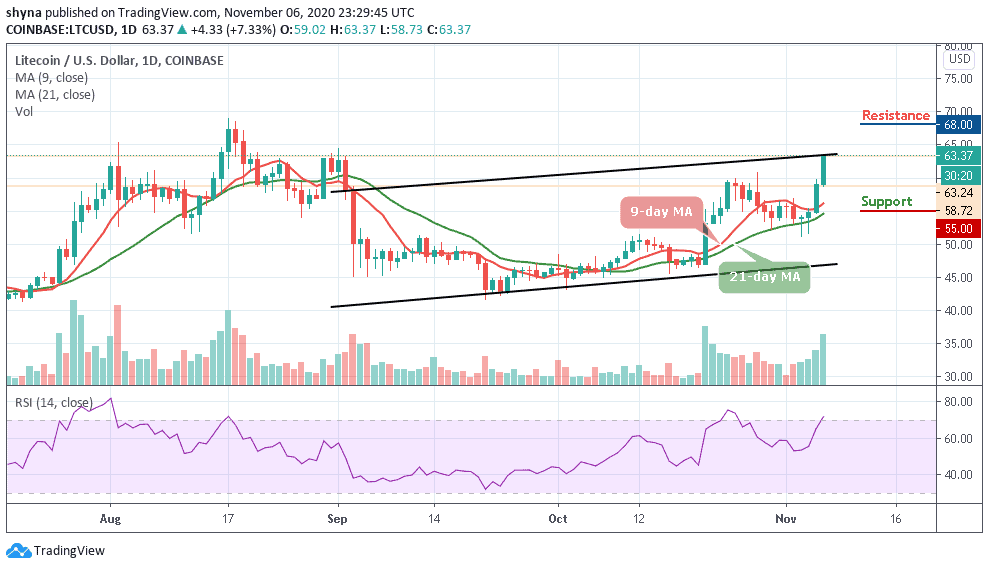
LTC/USD is seen fetching a decent hike in the last 24 hours that took the coin above the $60 level. The coin is already is keeping four straight days of bullish movements. Meanwhile, LTC/USD is one of the most emerging coins of the market at the moment, and it is likely to touch $65 in the coming days as its next resistance. The long-term outlook may continue to be bullish.
Would Litecoin Go Up or Down?
As the daily chart reveals, the Litecoin price is trading above the 9-day and 21-day moving averages within the ascending channel. On the upside, if the price breaks above the upper boundary of the channel and closes above it, LTC/USD may likely continue its uptrend and could reach the resistance levels of $68, $70, and $72.
In other words, if the technical indicator failed to break into the overbought region, there is the tendency of the bears to return into the market and this may likely cause the market price to hit the nearest support levels at $55, $53, and $51 respectively. Technically, the RSI (14) is crossing above the 70-level, suggesting additional bullish signals.
Against Bitcoin, Litecoin has remained fairly static. However, we have seen an increase from 3781 SAT to 4070 SAT today where the resistance was found. The recent increase has also allowed the cryptocurrency to climb above the 9-day and moving average which is a promising sign for buyers.
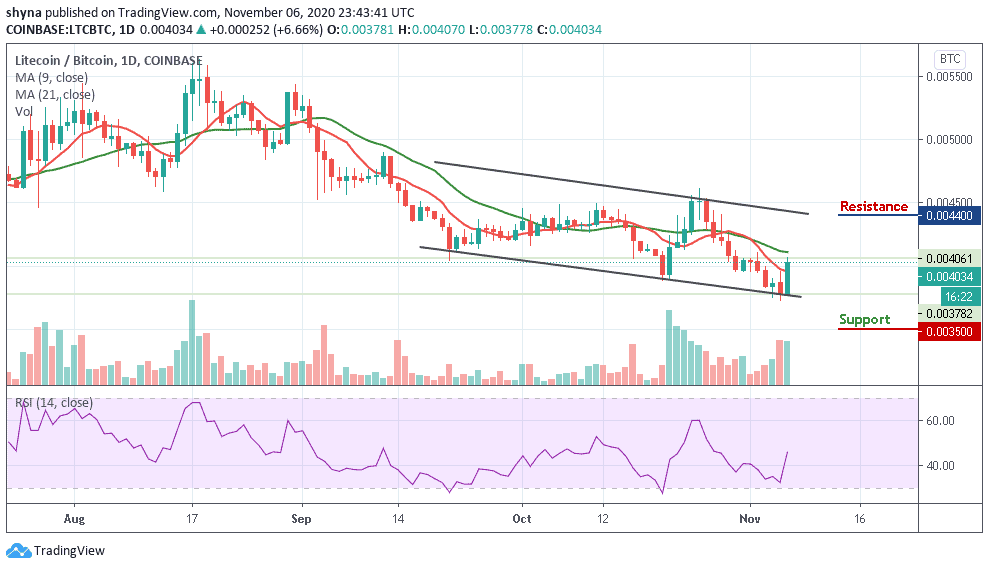
From above, if the bulls can break above the 21-day moving average, higher resistance is then located at 4400 SAT and 4500 SAT. However, from the downside, the nearest level of support now lies below the channel. Beneath this, further support is at 3500 SAT and 3400 SAT respectively. However, the RSI (14) is breaking above the 45-level which is a promising sign for the bulls as the momentum is on their side.
Join Our Telegram channel to stay up to date on breaking news coverage