Join Our Telegram channel to stay up to date on breaking news coverage
Litecoin (LTC) Price Prediction – October 30
The LTC/USD price is seen dropping from $55.81 to $52.27 within 24 hours as the technical indicator slides below 60-level.
LTC/USD Market
Key Levels:
Resistance levels: $60, $62, $64
Support levels: $48, $46, $44
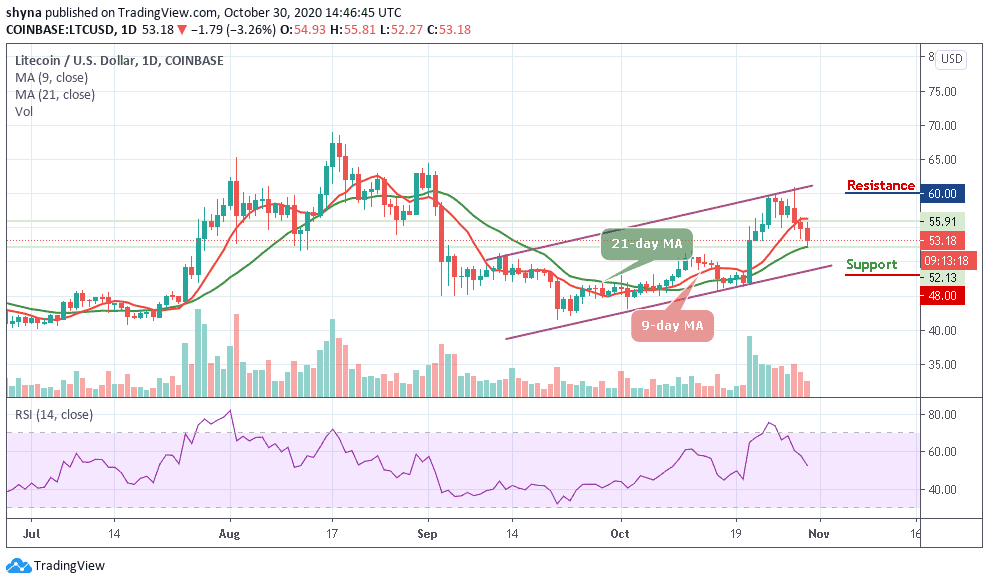
LTC/USD is currently trading below the 9-day moving average and within the ascending channel, the $50 support level may be penetrated by the bears provided there is an increase in the bears’ momentum and the price may fall below the 21-day moving average which is at $50.24 support level. In case the $54 support level holds, there could be a rebound and the price may begin a bullish movement.
What is the Next Direction for Litecoin?
Looking at the daily chart, LTC/USD is bearish and all the gains accrued by the pair from October 22 have been cleared by the bears. The bears are currently holding the LTC/USD market as the RSI (14) swings back into the negative zone following the past few days of severe drops, suggesting a bearish action in the market. Meanwhile, if the coin breaks below the 21-day MA, it may continue to decline towards the critical supports at $48, $46, and $44.
Currently, the coin is hovering around the $53.18 level following the recent drop. However, the market may likely bounce higher to $55 and $57 resistance level but the potential resistance to watch for are $60, $62, and $64 levels. For now, Litecoin price is on a downward movement and there’s a high probability for more breaks than a bounce.
Against Bitcoin, Litecoin (LTC) is still following a sideways movement within the channel and the coin is currently trading at 3977 SAT. With the bearish volume accumulating on the chart, the price may likely fall to 3900 SAT before reaching the 3800 SAT and below.

However, the RSI (14) is currently dropping below the 40 level, which indicates bearish movement in the market. However, for LTC/BTC to increase and move towards the resistance levels of 4200 SAT and above, the RSI (14) may need to go cross above the 50-level and the market price crossing above the moving averages.
Join Our Telegram channel to stay up to date on breaking news coverage