Join Our Telegram channel to stay up to date on breaking news coverage
LTC Price Prediction – April 18
The price of the Litecoin is currently changing hands at $43.79 as the stochastic RSI indicator faces the north.
LTC/USD Market
Key Levels:
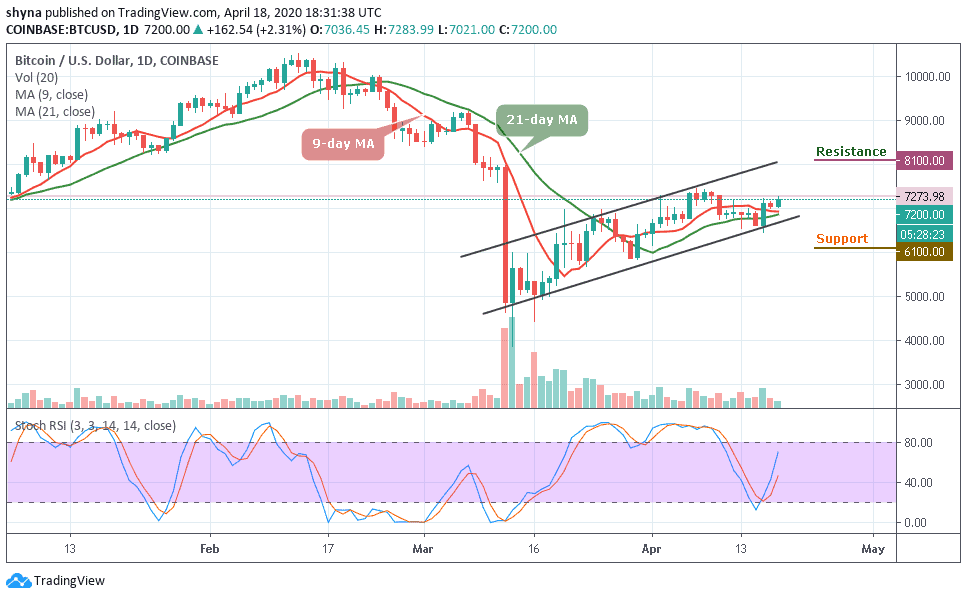
Resistance levels: $54, $56, $58
Support levels: $30, $28, $26
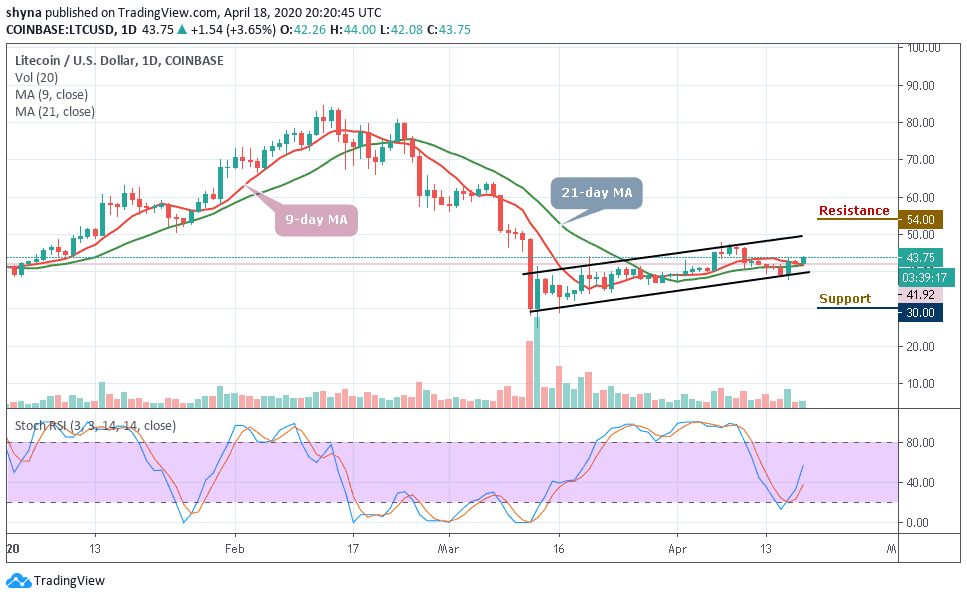
LTC/USD is trading in the green in today’s session, moving above the 9-day and 21-day moving averages where the coin has gained over 3.6%. Litecoin (LTC) broke out from a narrowed range block formation, but price action is capped at $43 and supported the decline to $40, under difficult conditions.
Furthermore, the Litecoin (LTC) price is still trapped in an incredibly narrow trading range since a few days ago; the bullish rally has failed to materialize several times. More so, LTC/USD has failed to clear the hurdles towards the resistance level of $45. Instead, the bears are trying to force their way back to the $42 support level.
However, a break below the $30 support level may provoke an even deeper decline towards the $28 and $26 support level. Looking at the stochastic (RSI), Litecoin may exhibit the tendencies to follow an upward trend as the signal lines focus on the north; the indicator may remain stable at the average.
In addition, if the bulls could make more effort and push the market towards the upper limit of the channel, then the price may likely hit the resistance levels of $54, $56 and $58 respectively.
Against BTC, the Litecoin price is making an attempt to cross the upper boundary of the channel in other to reach the resistance at 6100 SAT. Unless this resistance is effectively exceeded and the price ends up closing above it, there might not be any reason to expect the long-term bullish reversal.
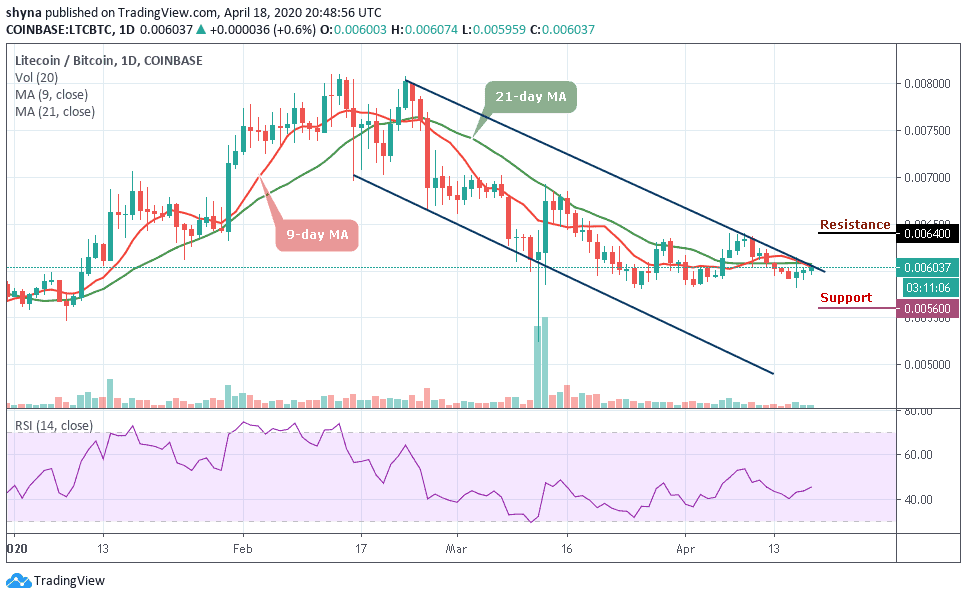
However, trading below the moving averages could refresh lows under 5800 SAT and a possible bearish continuation may likely meet the major support at 5700 SAT before falling to 5600 SAT and below while the buyers may push the coin to the potential resistance at 6400 SAT and above. More so, the RSI (14) moves above 45-level to give more bullish signals.
Please note: Insidebitcoins.com is not a financial advisor. Do your research before investing your funds in any financial asset or presented product or event. We are not responsible for your investing results.
Join Our Telegram channel to stay up to date on breaking news coverage