Join Our Telegram channel to stay up to date on breaking news coverage
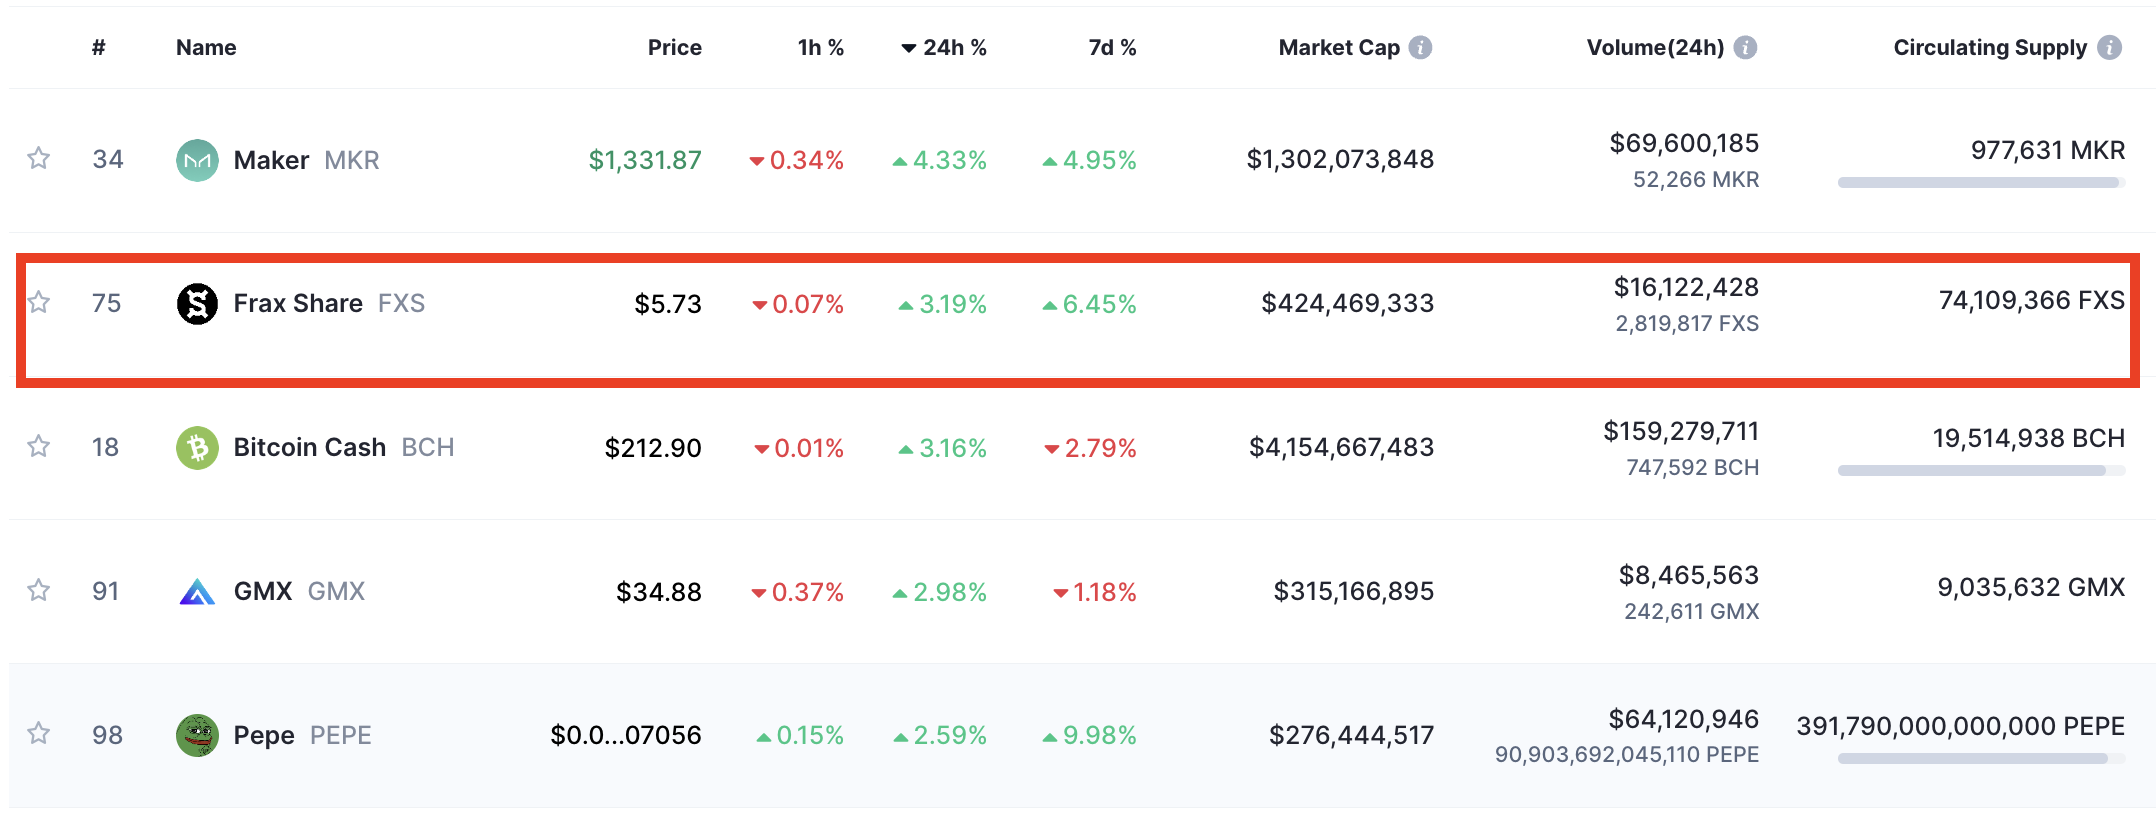
Frax Share (FXS) is one of the coins leading gains among top-cap cryptocurrencies after rallying more than 3% over the last 24 hours to trade just above $5.73.
It has gained about 8% over the last seven days, rising as much as 22% to today’s intraday high of $5.81.
This uptick is accompanied by a leap in trading volume, which is up 24% to $16 million on the day. Its live market cap now stands at $424.9 million, placing it at #75 on the CoinMarketCap ranking.
Top Gainers Today
The latest bullish streak displayed by FXS has been attributed to the launch of FraxV3. As a result, there has been a growing demand for Frax Share on the blockchain.
@fraxfinance is building it's own L2 – #Fraxchain which is going to use frxETH as gas fees –> burning the frxETH supply and boosting yield
– #FraxV3 is set go go live this week introducing FraxBonds – FXBs
What is this and why it's important?👇 pic.twitter.com/1lMmx0TU5X— Bogdaanpustovar (@Bojo0x) September 25, 2023
The growing demand has led to increased buying pressure, which according to data from Alpha Metrics, a software solutions company, reached almost $500,000 on Sept. 25. This adds to the bullish factors behind FXS’s uptick.
Conclusion:@fraxfinance has strong growth catalyst in form of FraxV3 launch, Fraxchain and #RWA narrative
Demand for $FXS is growing onchain
DYOR but I'm bullish on $FXS
Support my content by your likes and follow link in Bio for daily updates
Alpha 👇https://t.co/UviQgmUEUe— Bogdaanpustovar (@Bojo0x) September 25, 2023
Frax Share Price Needs to Flip $5.85 Into Support
At press time, the token is attempting to shatter resistance from the 50-day Simple Moving Average (SMA) at $5.75. A more stubborn barrier sits around the $5.85 area close to the 100-day SMA. According to an X user going by the name the Greatest, the Frax Share price has to flip this level back into support in order to sustain the uptrend.
📈 $FXS is on a radar BUT only if we flip this 5.85 level. If we do, I will open long to at least 7/7.2. But it has to flip and confirm first, otherwise would be stuck in a squeeze #crypto #cryptocurrency #fxs #fraxshare #blockchain #trading #altcoins pic.twitter.com/KKQcWFgqCo
— theGreatest (@thegreatest_sv) September 26, 2023
If this happens, then FXS would climb to fight resistance from the $6.0 psychological level, After which, a rise toward the top of the declining parallel channel at $6.80 would be the next logical move.
Such a move would represent an 18% increase from the current price. This is where Frax Share’s upside could be capped in the short term.
FXS/USD Daily Chart
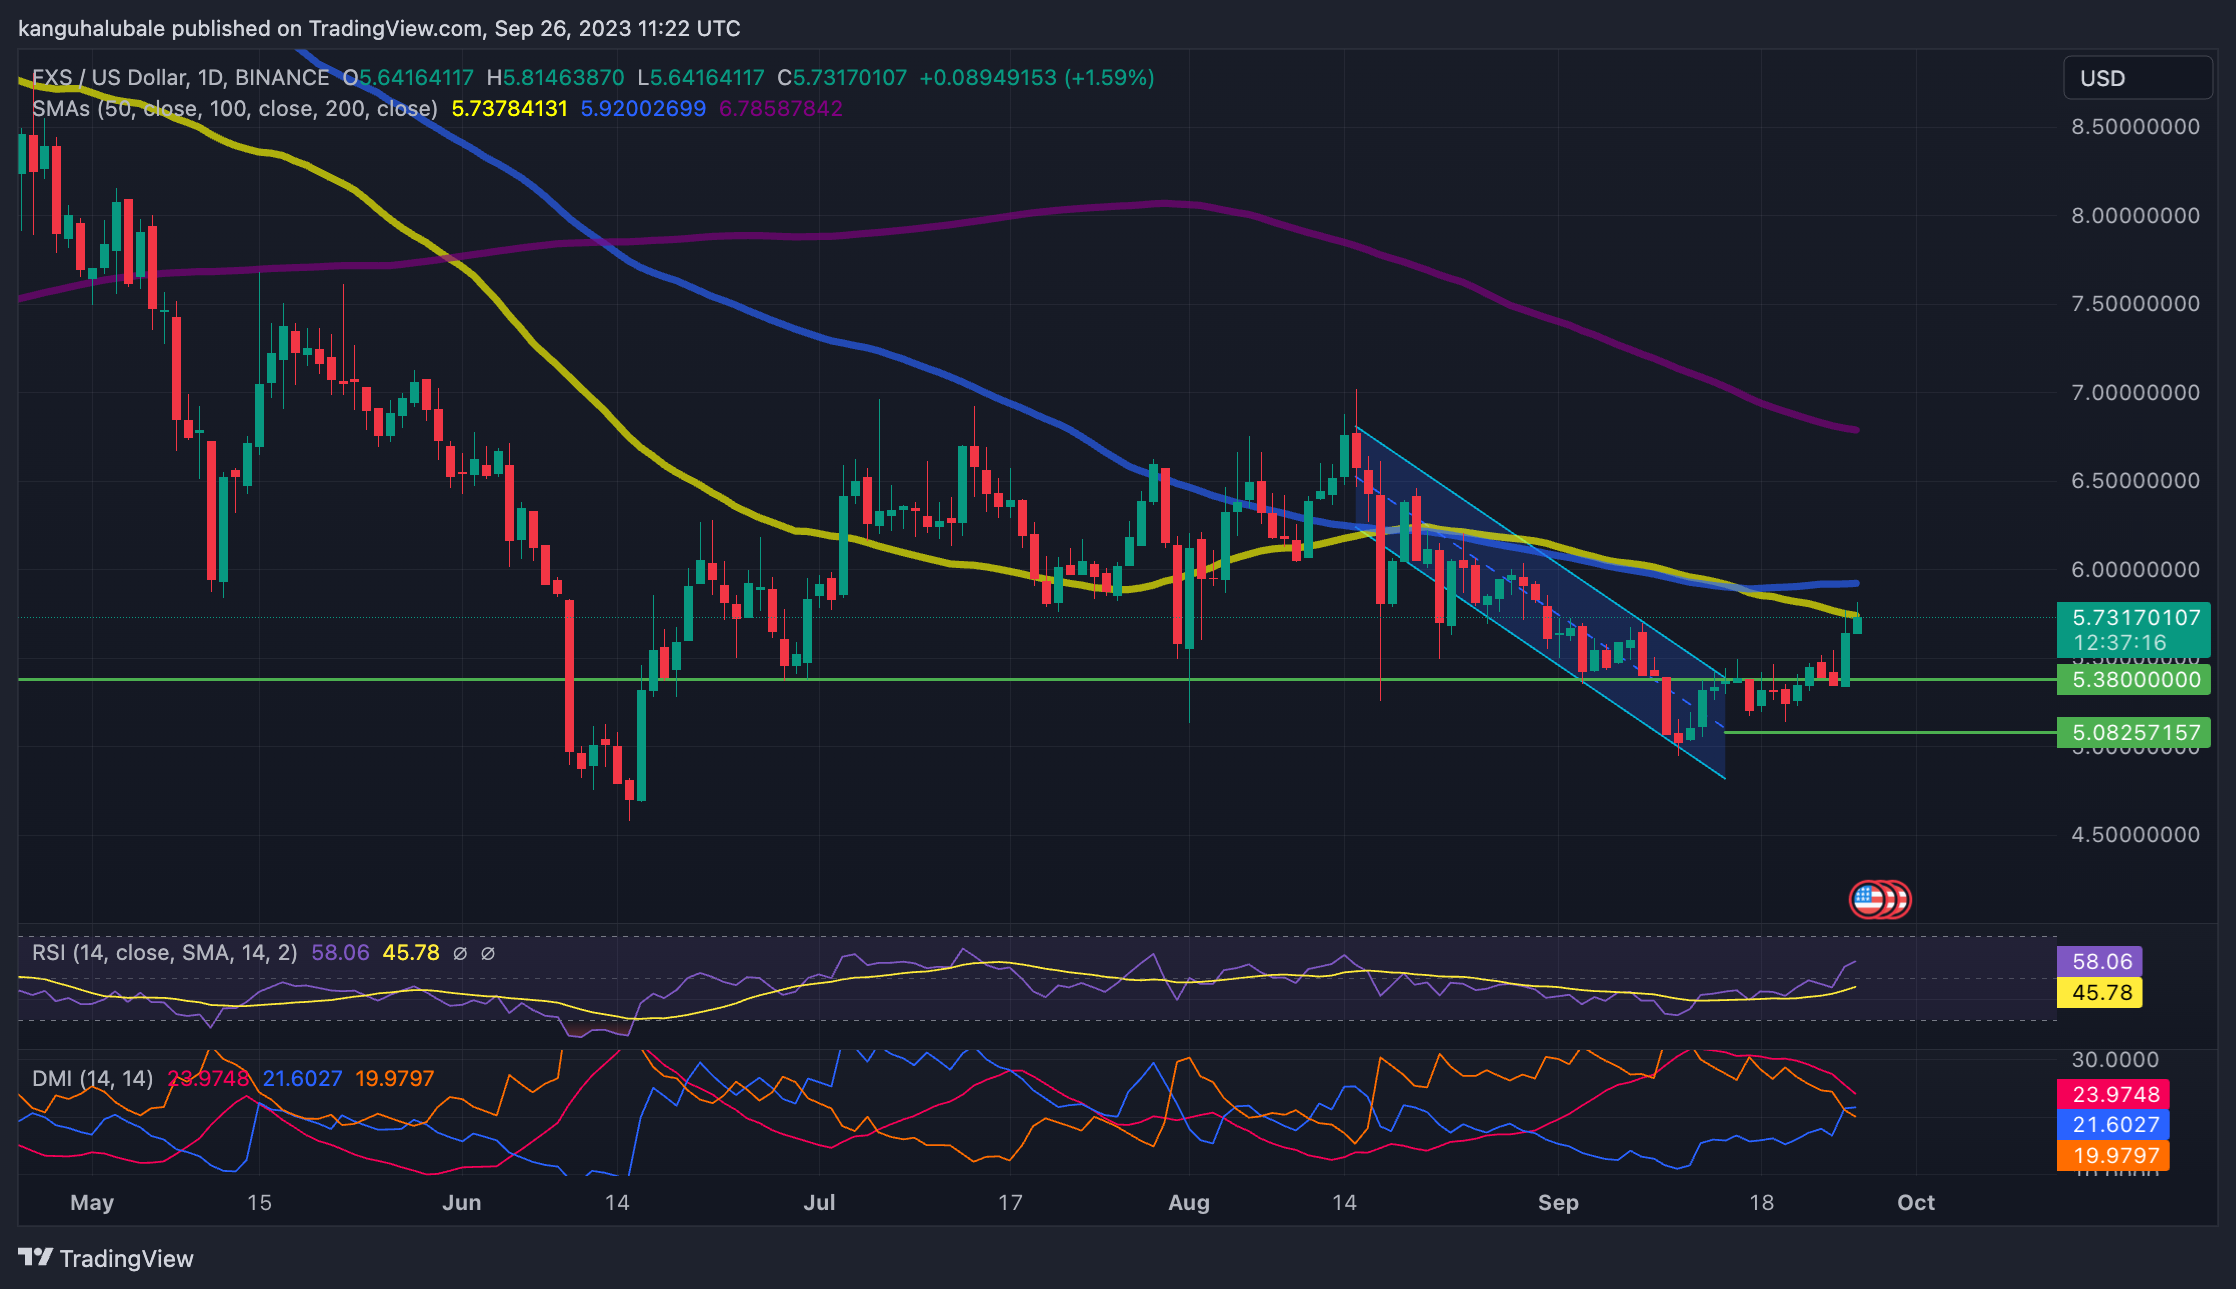
Several technical indicators supported FXS’s bullish narrative. The Relative Strength Index (RSI) was moving upward in the positive region. Its value at 58 above the midline suggested that there were more buyers than sellers in the market.
This was reinforced by the Directional Movement Index (DMI) which had just sent a call to buy Frax Share. This occurred on Monday, Sept. 25, when the positive directional line (+D) crossed above the negative directional line (-D). This was an indication that the buyers were returning to the market.
On the downside, FXS faced stiff resistance in its recovery path. The most stubborn roadblock was the $5.7 to $6.0 supplier congestion zone. Note that this is where the slow-moving 50-day and 100-day SMAs sat.
This was accentuated by on-chain data from IntoTheBlock, a blockchain data analytics firm. Its In/Out of the Money Around Price (IOMAP) model validated the fact the token faced stiff resistance on the upside, contrary to the support it enjoyed on the downside.
According to the IOMAP chart below, the said supply zone is close to the $5.75 and $5.91 price range. This is where approximately 4.35 million FXS tokens were previously bought by roughly 594 addresses.
Frax Share IOMAP Chart
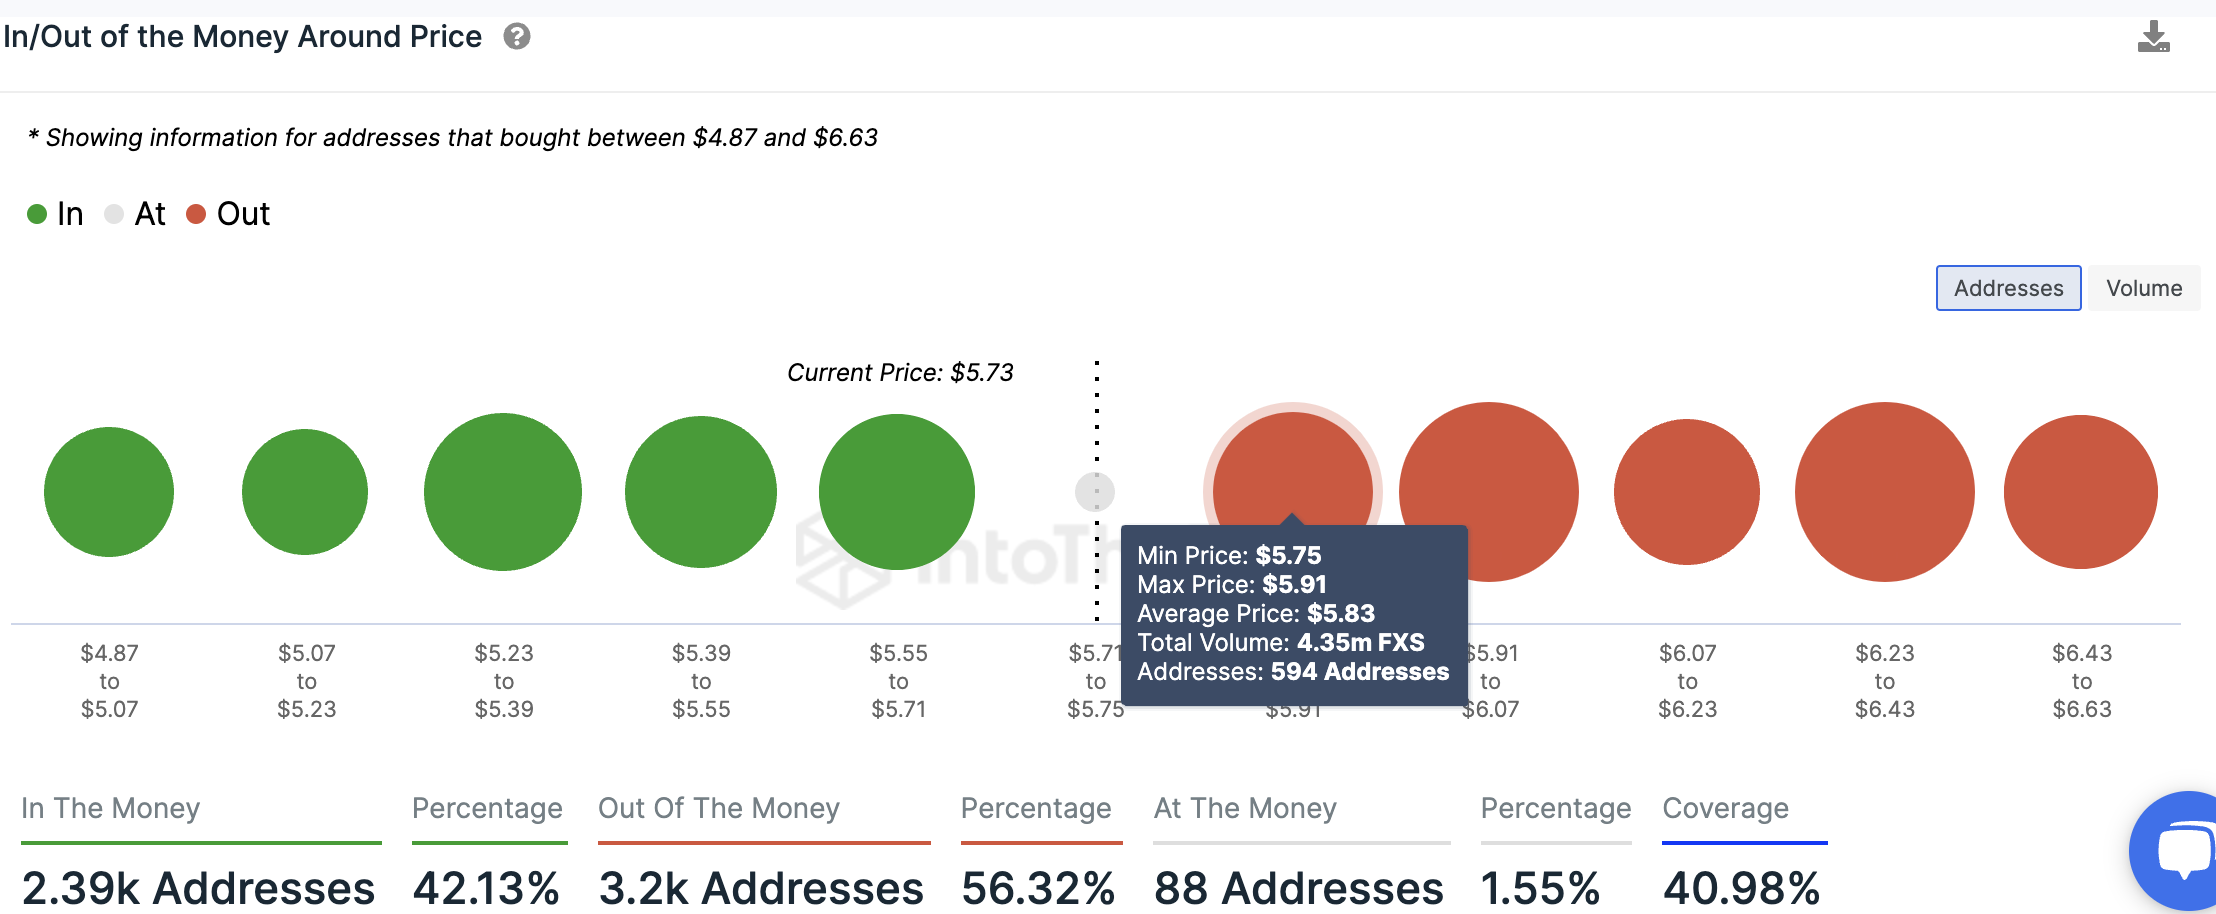
Any attempts to push the price higher would be met by intense selling from this cohort of investors who may wish to break even. This also reinforces the earlier statement that Frax Share’s upside may be capped around this level.
Therefore, increased overhead pressure from this zone could cause FXS to turn down from the current price first toward the $5.3 major support level and later to the middle boundary of the descending channel at $5.08. A drop lower could bring areas around $5.0 into the picture.
As promising as FXS looks, the technical analysis above reveals that it might register only up to 2% gains in the near term. As such, investors are turning to more promising alternatives with the potential to make between 10X and 100X returns with a low-risk-to-reward ratio. One of them is discussed next.
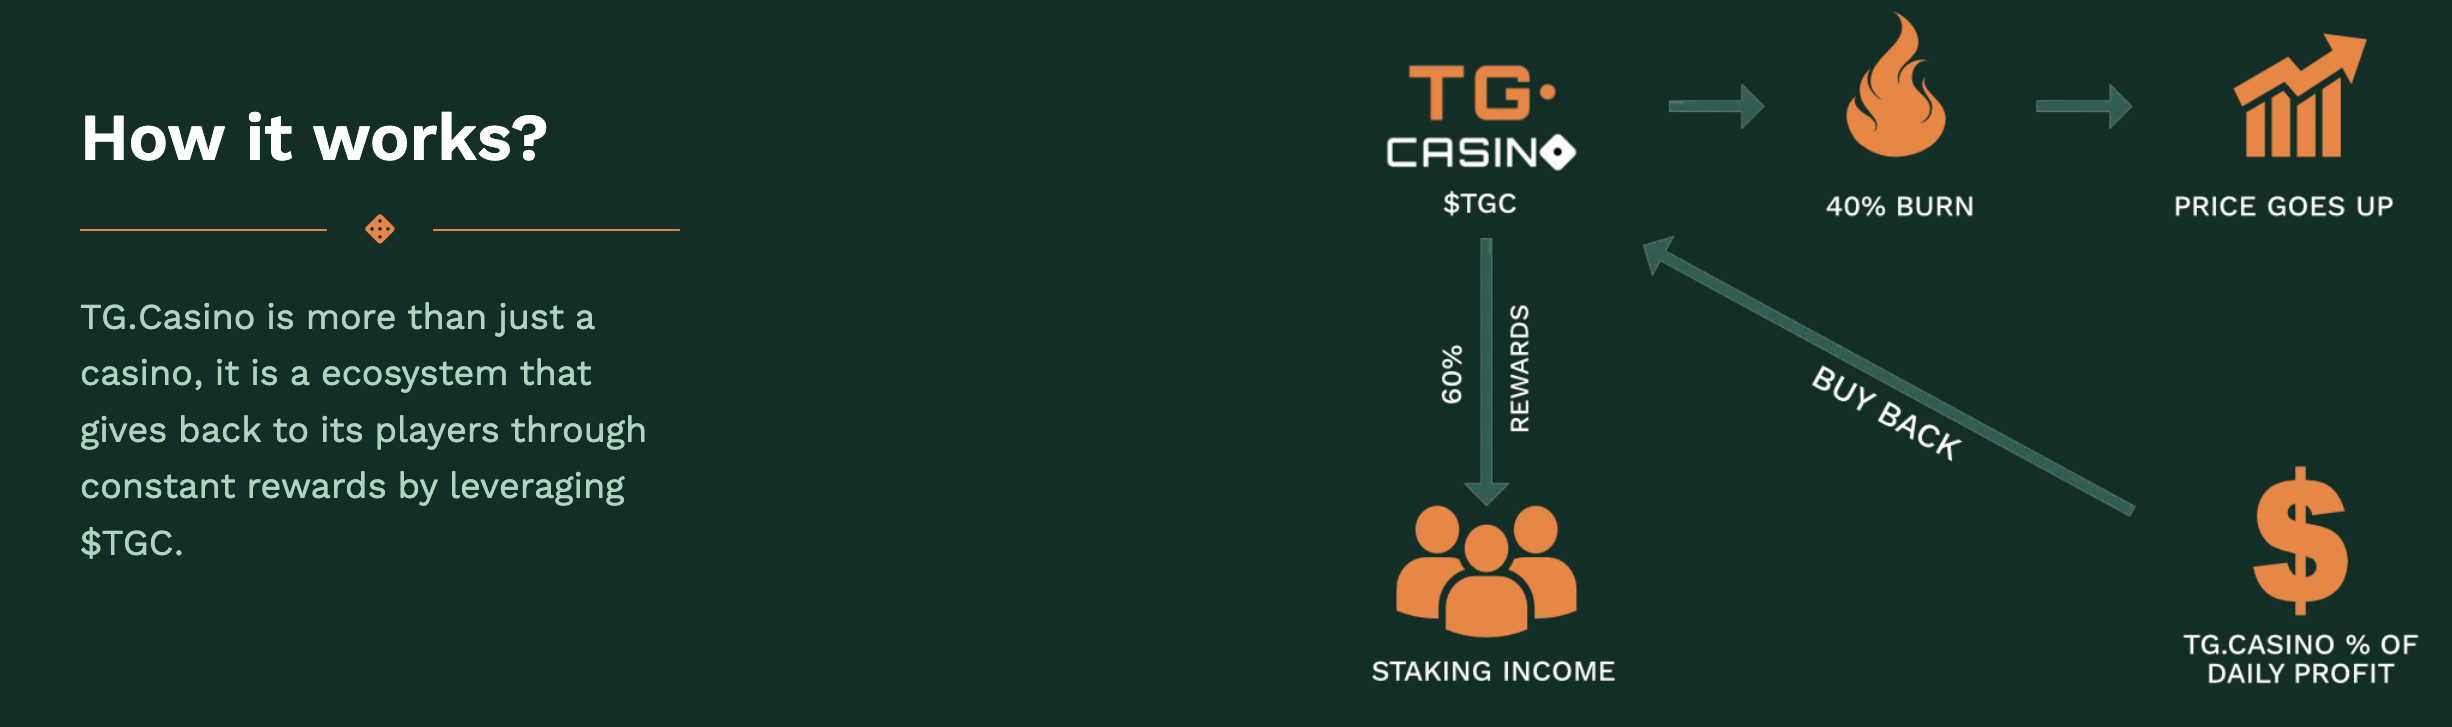
FXS Alternatives: TG.Casino – World’s #1 Telegram Casino
TG.Casino ($TGC) is a fully licensed Telegram casino. It is a new cryptocurrency in presale offering huge staking rewards and access to various casino games and NFT rewards.
Built on Ethereum, TG.Casino uses Telegram and cryptocurrency to offer a unique take on online gambling.
It launched its presale only a few days ago, yet it has already raised more than $220,000, representing 22% of its sale’s $1m soft cap.
The $TGC presale is live – your golden ticket to exclusive rewards and benefits. Don't miss out!
⭐️What's Live from https://t.co/1CivTnIx4Z ⭐️
💵Presale
🚀Staking for Rewards⏰ Coming Very Soon ⏰
📢 Huge Marketing
🎰 Casino Launch
🪙 Token Launch pic.twitter.com/FKzkYTrcXj— TG Casino (@TGCasino_) September 20, 2023
It’s clear that investors have already been won over by TG.Casino’s overall design and architecture, with the online casino tapping into the pre-existing user base on Telegram.
Its presale will make available 40% of TGC’s overall supply of 100 million TGC, with 20% going to staking rewards, 20% going to DEX liquidity, and 10% to rewards (another 10% will go to marketing and affiliates).
Interested investors can participate in TGC’s sale by visiting the official TG.Casino website and connecting their wallets, with 1 TGC going for $0.125.
The sale will have only one stage, at which point the coin will list on exchanges, potentially making its early investors a big profit.
Visit TG. Casino here for more information.
Related News
Best Wallet - Diversify Your Crypto Portfolio

- Easy to Use, Feature-Driven Crypto Wallet
- Get Early Access to Upcoming Token ICOs
- Multi-Chain, Multi-Wallet, Non-Custodial
- Now On App Store, Google Play
- Stake To Earn Native Token $BEST
- 250,000+ Monthly Active Users
Join Our Telegram channel to stay up to date on breaking news coverage