Join Our Telegram channel to stay up to date on breaking news coverage
AUDUSD Price Analysis – May 27
Should the Bears exert more pressure, further declination in price is certain and the currency pair may target $0.680 level. In case the Bulls prevailed over the Bears at the $0.692 level, the price may target $0.701 price level.
AUD/USD Market
Key levels:
Supply levels: $0.692, $0.701, $0.711
Demand levels: $0.680, $0.670, $0.661
AUDUSD Long-term trend: Bearish
On the daily chart, AUDUSD is bearish. The currency pair remains bearish on the long-term outlook. The Bears momentum became weak along the way and the pair could not reach the $0.680 level. On May 23, the bulls tried to push the price up with the formation of weak bullish candles but could not break up the supply level of $0.692 due to the weak momentum. Today, another daily bearish candle emerged; this may imply that the Bears are ready to continue with the bearish trend.
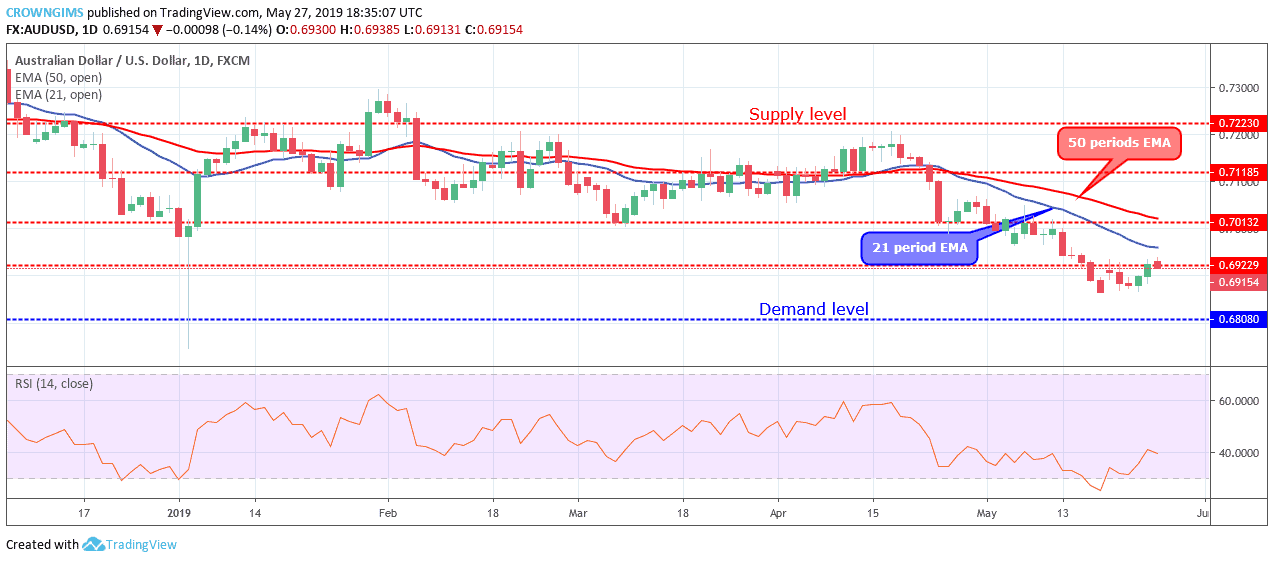
AUDUSD continue trading below the 21 periods EMA and 50 periods EMA. The Relative Strength period 14 is at 40 levels with the signal lines pointing downside to indicate sell signal and a further declination in AUDUSD price. Should the Bears exert more pressure, further declination in price is certain and the currency pair may target $0.680 level. In case the Bulls prevailed over the Bears at the $0.692 level, the price may target $0.701 price level.
AUDUSD medium-term Trend: Bullish
The Bulls are taking over gradually in the medium-term outlook. The Bulls seldom increase their momentum on the 4-hour chart and broke up the $0.692 level. Shortly after the breakup, the price consolidated for a few hours. Today, the price pulled back with the formation of bearish candles that is returning the price below the level of $0.692.
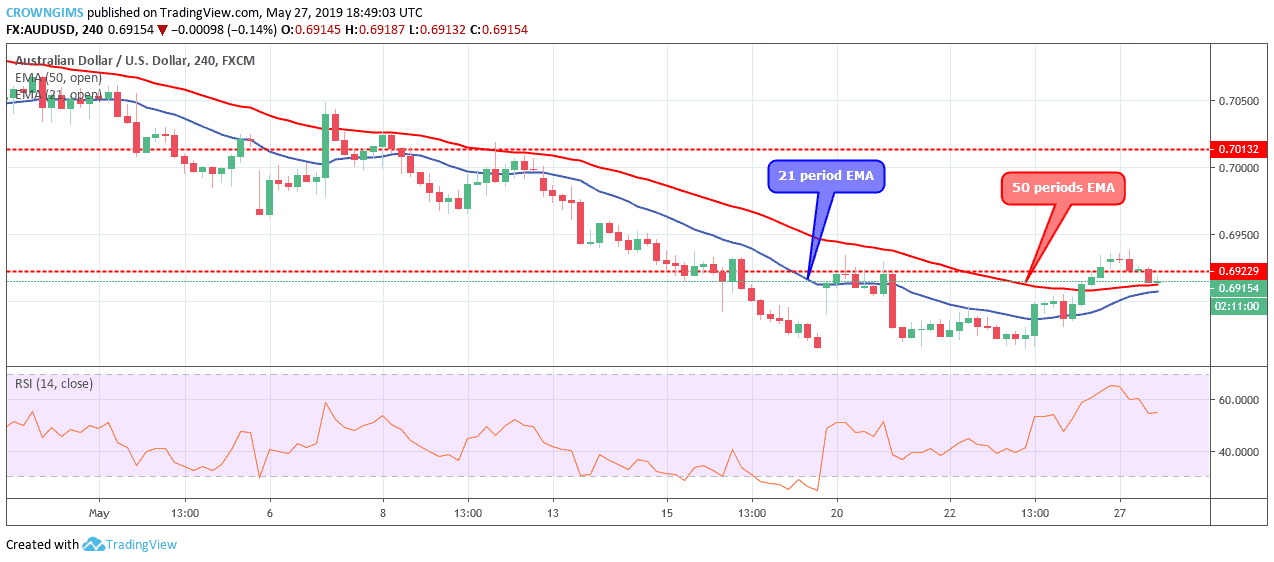
The currency pair is directly trading over the 21 periods EMA and 50 periods EMA with the two EMAs coming close to each other as a sign of weak bearish and bullish momentum. However, the Relative Strength Index period 14 is below 60 levels and the signal line tends to flat which indicates weak bullish and bearish momentum.
Please note: insidebitcoins.com is not a financial advisor. Do your own research before investing your funds in any financial asset or presented product or event. We are not responsible for your investing results.
Read more:
Join Our Telegram channel to stay up to date on breaking news coverage