Join Our Telegram channel to stay up to date on breaking news coverage
ETH Price Prediction – December 30
Ethereum has been battling with the $750 resistance as the price failed to break it.
ETH/USD Market
Key Levels:
Resistance levels: $800, $820, $840
Support levels: $680, $660, $640
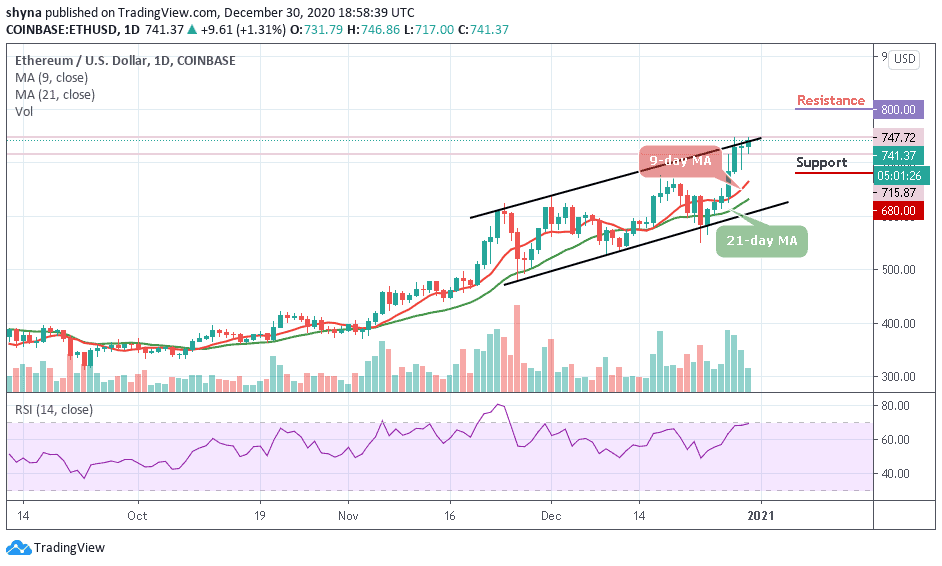
ETH/USD is currently in consolidation above $740 after touching a yearly high of $747 a couple of days ago. However, the price has come down a little bit, compared to the recent gains. The technical indicator is now moving into the overbought region as bulls remain dominant to end 2020 on a high note.
What to Expect from Ethereum (ETH)
At the time of writing, the pair is trading at $741, near the upper boundary of the channel. Meanwhile, the current pullback won’t worry bulls as the massive volume floor underneath the pair will support it for another bull-run once 2021 kicks in. The technical indicator is also lining up nicely to support further uptrend. The support at $700 could ward off any short-term pullback.
The current rising trend line is near $750 and is sloping upwards. Despite the pressure from the bears, the price channel is trending upwards. ETH/USD buyers are booking short-term profits near $745 resistance only to accumulate at lower price levels near $715. The top at $747 will further entice some bears to book profits. The resistance levels to watch are $800, $820, and $840 while the supports are located at $680, $660, and $640 respectively.
When compares with BTC, Ethereum is trading above the 9-day moving average and the price is now hovering at 2620 SAT as the technical indicator RSI (14) moves to cross below the 40-level. For the fact that the bears remain the dominant of the market, the pair seems to be moving towards the south.
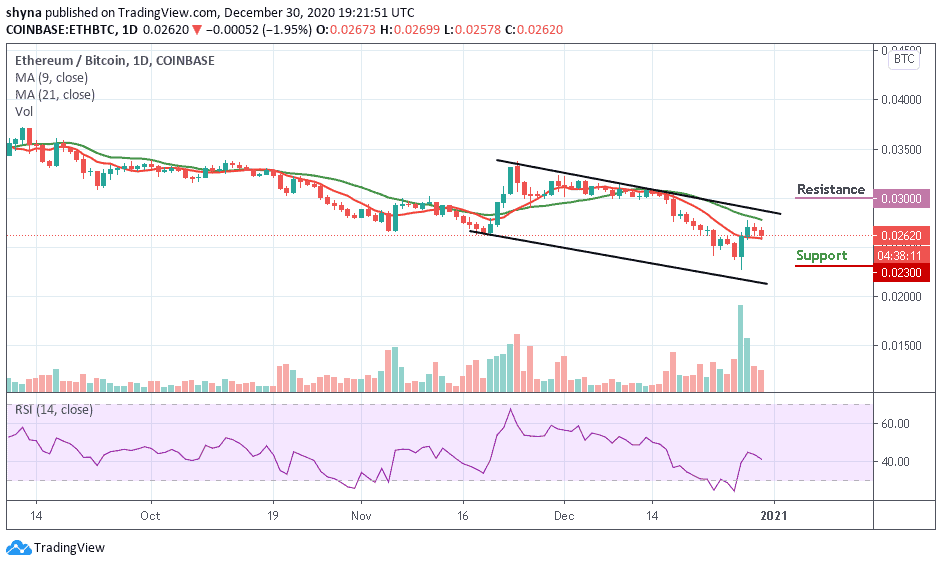
However, the support levels to be reached are 2300 SAT and 2200 SAT. On the other hand, a higher sustainable move may likely cancel the bearish pattern and this could attract new buyers coming into the market with the next focus on 3000 SAT and 3200 SAT resistance levels.
Join Our Telegram channel to stay up to date on breaking news coverage