Join Our Telegram channel to stay up to date on breaking news coverage
ETH Price Prediction – November 7
The Ethereum price is seen climbing higher and settling above the main $460 barrier against the US Dollar.
ETH/USD Market
Key Levels:
Resistance levels: $500, $510, $520
Support levels: $420, $410, $400
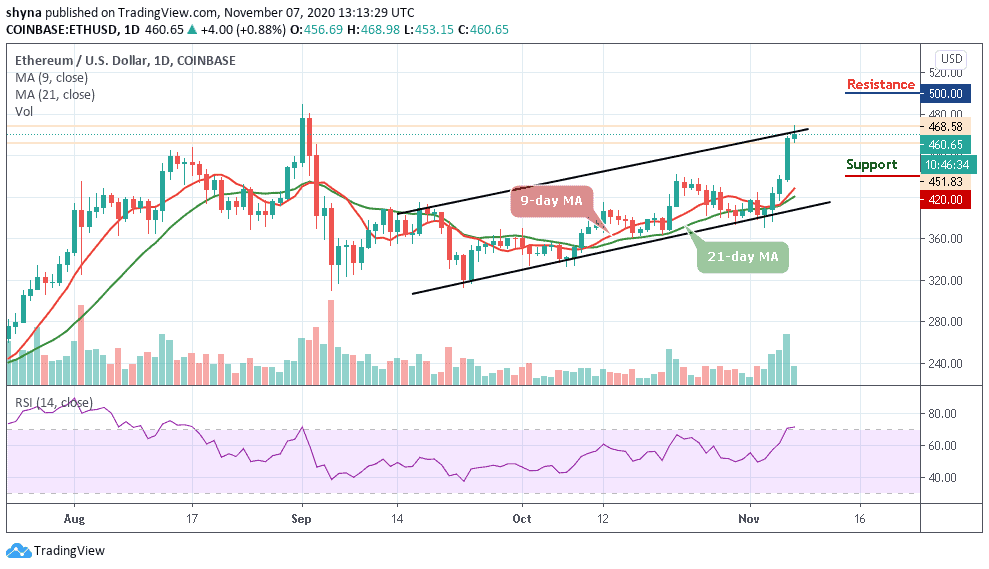
ETH/USD had a significant boost yesterday and this allowed the coin to exceed the $450 level, this momentum extending considerably as crypto continues to climb higher today. The current performance of the coin indicates the addition of an upward movement since some weeks ago. It’s just a matter of time for this coin to reach a $500 level in the nearest term.
What to Expect from Ethereum (ETH)
In the last few days, Ethereum has moved from $383 to $468 and towards the upper boundary of the channel at the time of writing. The on-going trend may move a little bit higher before the week runs out, and the coin may likely reach the nearest resistance at $480, but if the bulls put more effort, it could hit additional resistance levels at $500, $510, and $520 respectively.
In other words, a bearish drop may roll the market back below the initial support level of $435. Meanwhile, any further bearish movement may likely hit the critical supports at $420, $410, and $400. As the trading volume increases, the technical indicator RSI (14) is seen moving into the overbought region and this could still supply more bullish signals into the market.
When compares with Bitcoin, Ethereum is trading above the 9-day and 21-day moving averages. The price is changing hands at 2993 SAT as the technical indicator RSI (14) stays above the 45-level. However, the buyers are just coming into focus and any further bullish movement may continue to push the market price above the moving averages and towards the upper boundary of the channel.
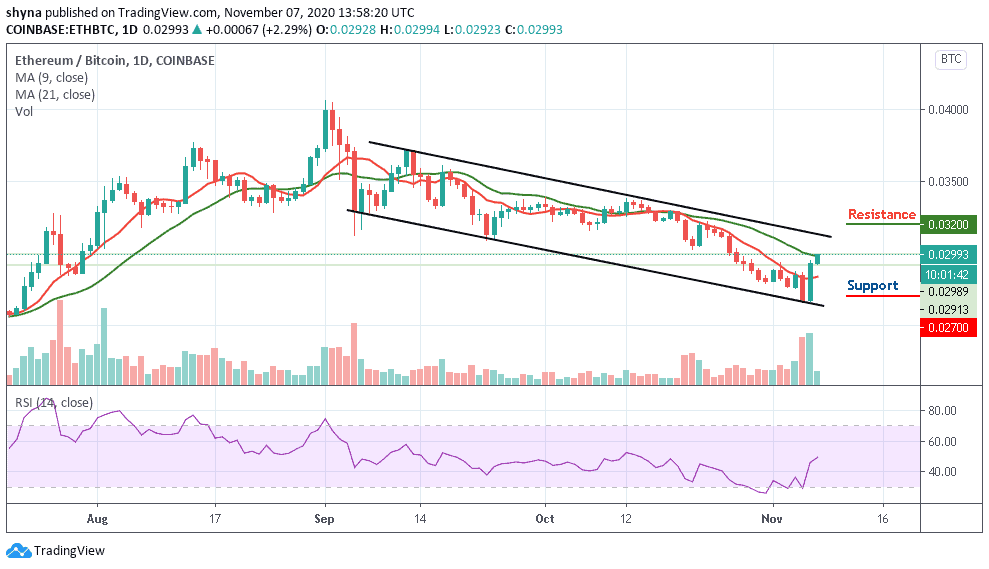
Positively, the resistance levels to be reached are 3200 SAT and 3400 SAT. Conversely, a lower sustainable move may likely cancel the bullish pattern if the price drops below the 9-day MA and it could attract new sellers to the market with the next focus on supports at 2700 SAT and 2500 SAT.
Join Our Telegram channel to stay up to date on breaking news coverage