Join Our Telegram channel to stay up to date on breaking news coverage
Bitcoin (BTC) Price Prediction – August 8
The daily chart reveals that BTC has corrected lower by at its current price of $11,759 as it continues to consolidate gains above $11K.
BTC/USD Long-term Trend: Bullish (Daily Chart)
Key levels:
Resistance Levels: $12,500, $12,700, $12,900
Support Levels: $10,900, $10,700, $10,500

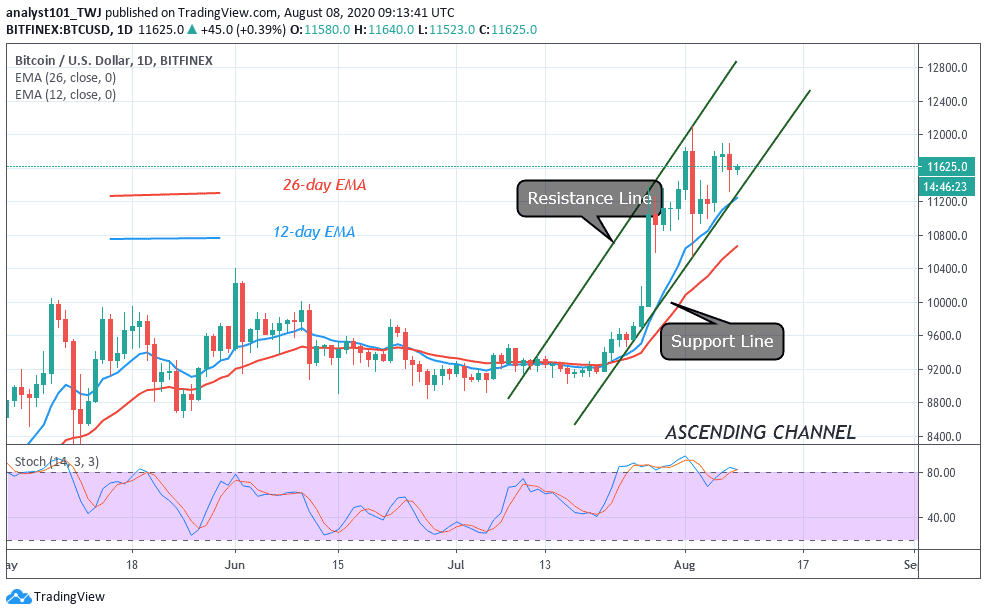
Yesterday, BTC/USD plunged to as low as $11,200 before the bulls bought the dip, and now back at the familiar price area of $11,500 – $11,600 at the time of writing. Bitcoin is currently experiencing a lackluster consolidation phase within the upper $11,000 zone as it struggles to surmount resistance near the $12,000 level.
However, the growth that the Bitcoin (BTC) price has seen in recent times indicates that the world’s leading crypto is forming a strong foundation for a new price increase. Although Bitcoin (BTC) hasn’t managed to break above $12,000, yet it appears that another uptrend in prices is imminent in the coming weeks.
What to Expect from Bitcoin (BTC)
At the time of writing, BTC/USD is hovering around $11,759. The daily chart reveals that Bitcoin (BTC) is trading within the rising channel against low trading volume. On the other hand, the liquidity level is high enough, which means that there is a low probability of seeing a sharp move soon. The first digital asset has bounced on the top of the 9-day MA, confirming the presence of the bulls. Any further bullish movements could reach the resistance levels at $12,500, $12,700, and $12,900.
However, as the RSI (14) moves below 70-level, traders may see BTC/USD trading between the $11,600-$11,800 levels by the end of the coming week. However, a possible decline could be considered as a part of a correction phase, the critical supports are located at $10,900, $10,700, and $10,500.
BTC/USD Medium-Term Trend: Bullish (4H Chart)
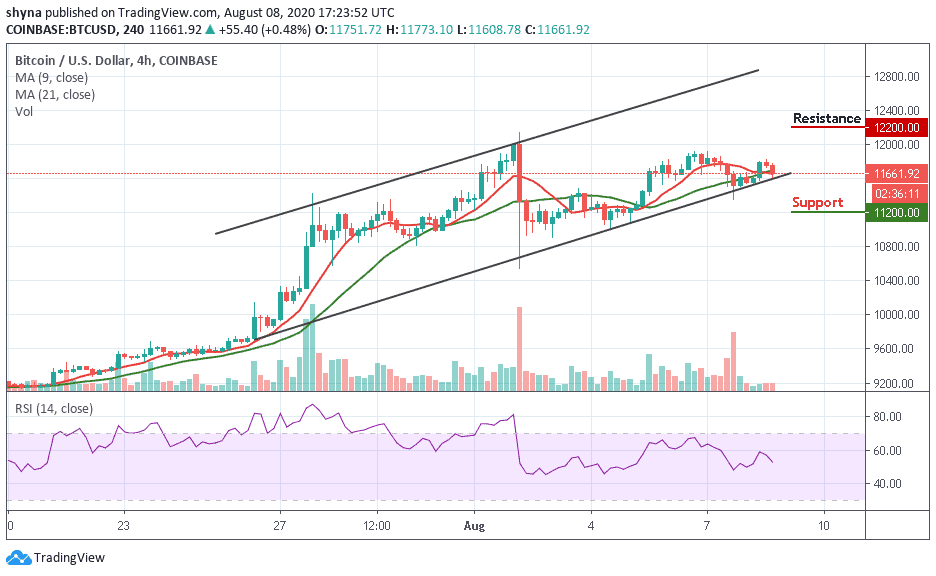
Looking at the 4H chart, the growth stopped after a false breakout at the $12,000 mark. For the moment, the RSI (14) is facing the south, Bitcoin (BTC) is likely to go down as the trading volume continues to decline while the market price is trading below the 9-day and 21-day moving averages.

If the current market movement breaks below the lower boundary of the channel, it may likely hit the support levels of $11,200 and below. On the contrary, the potential resistance levels lie at $12,200 and above.
Join Our Telegram channel to stay up to date on breaking news coverage

