Join Our Telegram channel to stay up to date on breaking news coverage
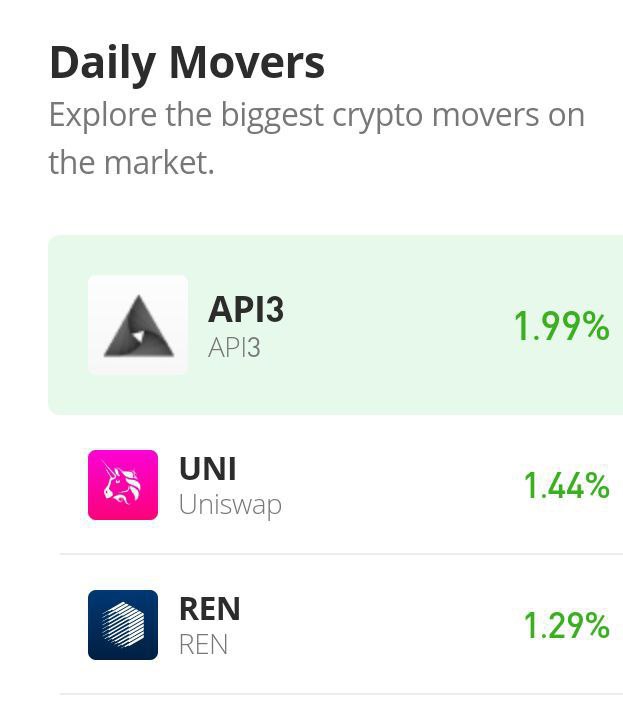
API3 Price Prediction – October 3
An obtainable trading sign suggests the API3/USD market operation attempts to push high past a resistance line at a logical zone. There are low and high value lines of $1.90 and $1.36, showing as the spots that price has kept in the last thirty days of transactions. As of the time of writing, the crypto market trades around $1.6756 point at an average percentage rate of 3.65 positive.
API3 Price Statistics:
API3 price now – $1.6756
API3 market cap – $93.4
API3 circulating supply – 56.6 million
API3 total supply – 114.9 million
Coinmarketcap ranking – #192
API3/USD Market
Key Levels:
Resistance levels: $1.90, $2.15, $2.40
Support levels: $1.50, $1.25, $1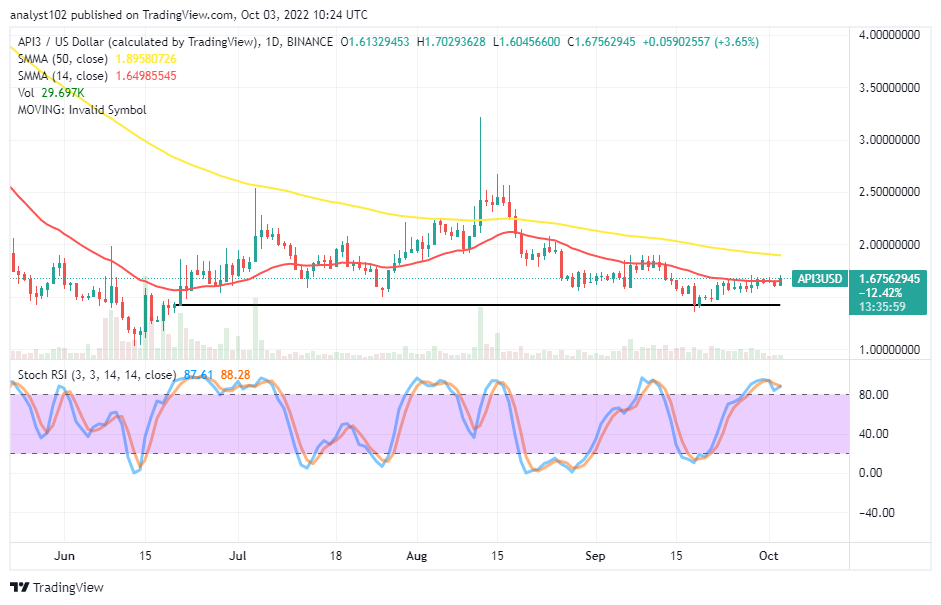 API3/USD – Daily Chart
The API3/USD daily chart showcases the crypto-market attempts to push high past a resistance trading zone of the smaller SMA’s trend line. The 14-day SMA indicator is at the $1.6499 point, underneath the $1.8958 value line of the 50-day SMA indicator. The Stochastic Oscillators have protruded into the overbought region, seemingly trying to cross back southbound at 88.28 and 87.61 range values to pose a warning signal against getting a further upward-running move from its current trading capacity value.
Your capital is at risk
What is likely to be the reaction of the API3/USD market around the 14-day SMA soon afterward?
The API3/USD market movers may be pressing against others at an equilibrium trading capacity around the 14-day SMA trading trend line sooner than later, even though it is currently that the crypto trade attempts to push high past resistance at a psychological zone. It appears not technically ideal to continue to jump into this market without observing an active price action to back an entry. All in all, buying spree at this point may need to suspend for a while.
On the downside of the technical analysis, an over-reading bought condition in the API/USD market by the Stochastic Oscillators poses the long-position placers have to be wary of any aggressive reversal that can occur closely underneath the trend line of the 50-day SMA or around the 14-day SMA trend line. An early false pull-up at the trading indicator will probably allow the market to run back southwardly to possibly revisit a previous low around the horizontal line drawn below the trend lines of the SMAs.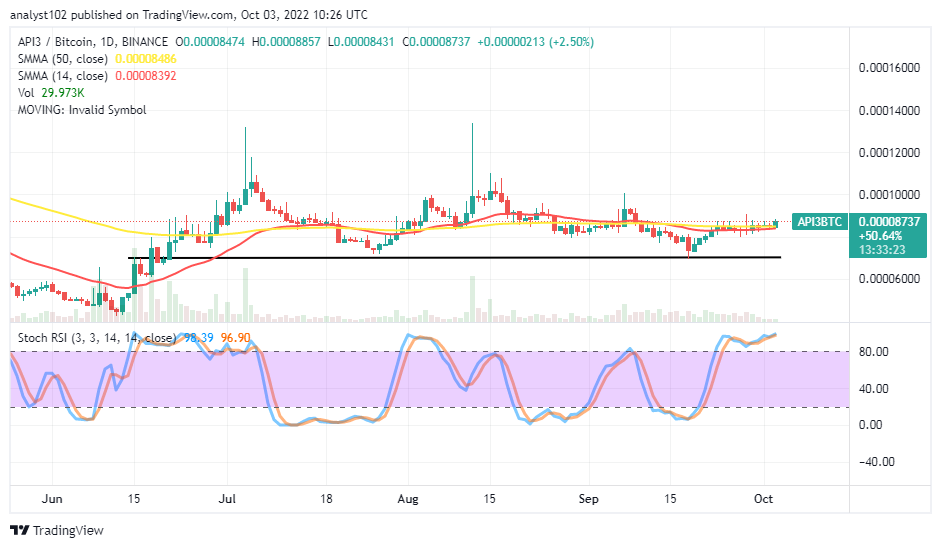
API3/BTC Price Analysis
API3 market operation has witnessed variant ups and downs around a high-trading range spot over several sessions. From a closer technical viewpoint, the currency pair market attempts to push high past a resistance point closely over the conjoined trending arena of the SMAs. The Stochastic Oscillators are in the overbought region, striving to stretch their lines northbound further at 96.90 and 98.39 range values. It shows the market can upkeep an upward move for a while.
Read more:
Join Our Telegram channel to stay up to date on breaking news coverage