Join Our Telegram channel to stay up to date on breaking news coverage
The ANKR price prediction shows that the coin could spike a significant surge if the price breaks above the moving averages.
Ankr Prediction Statistics Data:
- ANKR price now – $0.040
- ANKR market cap – $392.2 million
- ANKR circulating supply – 9.66 billion
- ANKR total supply – 10 billion
- ANKR Coinmarketcap ranking – #92
ANKR/USD Market
Key Levels:
Resistance levels: $0.060, $0.065, $0.070
Support levels: $0.025, $0.020, $0.015
Your capital is at risk
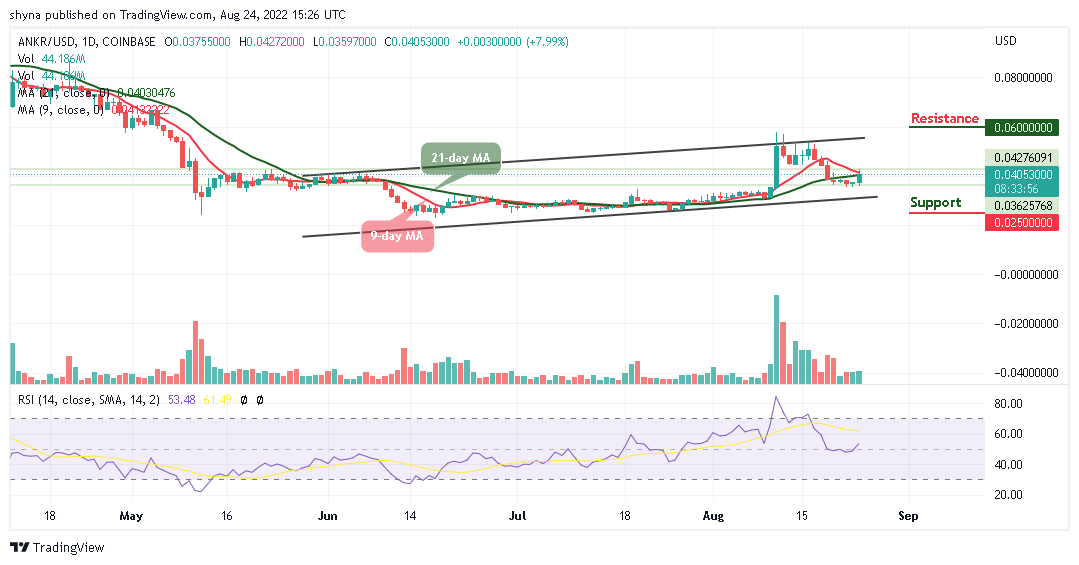
ANKR/USD is creating a new bullish movement after touching the daily low of $0.035 to breaches above $0.042 as the coin currently trades at $0.040 preparing to cross above the 9-day and 21-day moving averages. However, while bears are attempting to bring the price back below the daily high of $0.042, the bulls may try to collect more on the price dips.
ANKR Triggers Fresh Rally as Tamadoge (TAMA) Goes Bullish
Looking at the daily chart, the Ankr price can only increase the bullish movement if the $0.035 support is maintained at all costs. Currently, the technical indicator Relative Strength Index (14) is likely to cross above the 60-level by sending bullish signals into the market which can encourage more buyers to enter the market.
Meanwhile, if the red line of the 9-day moving average crosses below the green line of the 21-day moving average, the crypto may head towards the negative side and the market price could reach the support levels at $0.025, $0.020, and $0.015 respectively. On the contrary, if the technical indicator decides to make a quick cross above the moving averages, then, there may be a quick bullish rise which may likely push the market up towards the upper boundary of the channel to hit the resistance levels of $0.060, $0.065, and $0.070 respectively.
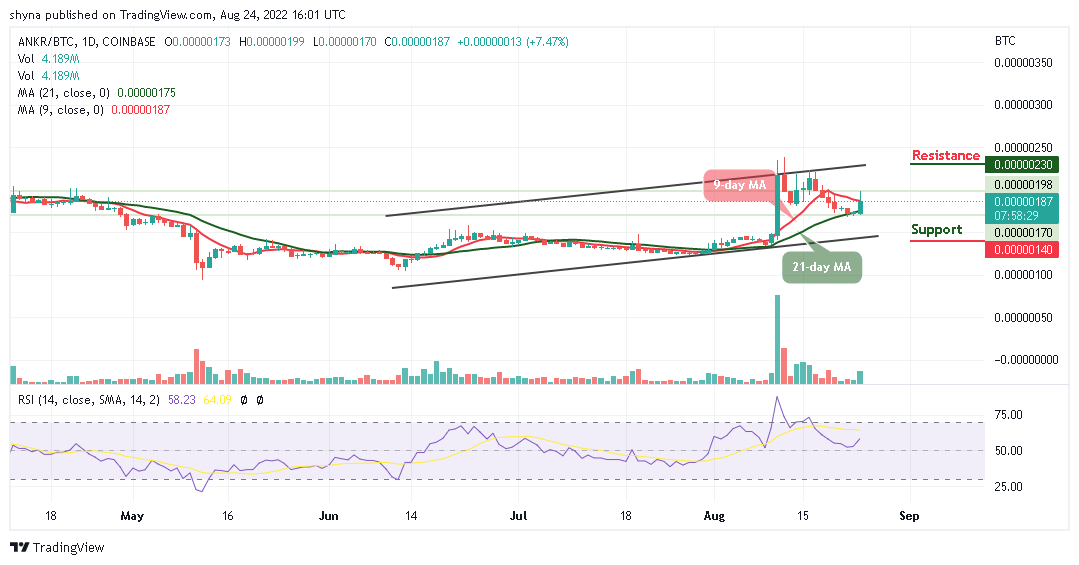
Again Bitcoin, ANKR price is still hovering within the 9-day and 21-day moving averages as the coin prepares to cross above the moving averages. Meanwhile, the technical indicator Relative Strength Index (14) is seen moving towards the 70-level. However, the fact that the market trades averagely, the coin is likely to move sideways before deciding on the next direction.
Moreover, the daily chart reveals that the potential resistance level is located at 230 SAT and above, but any bearish movement may cancel the bullish pattern and attract new sellers to come into the market with the next focus on the support level at 140 SAT and below.
Tamadoge has assimilated the lessons learned from other projects. Revenue is generated by fees paid on transactions in the Tamadoge NFT Petstore, where players buy clothes, food, and other necessities and discretionary items for their pets. You can own as many pets as you like, with the individual traits of each Tamadoge pet constituted as an NFT.
Related:
Join Our Telegram channel to stay up to date on breaking news coverage