Join Our Telegram channel to stay up to date on breaking news coverage
The Storj price prediction reveals that STORJ spikes to the upside as the coin moves to cross above the upper boundary of the channel.
Storj Prediction Statistics Data:
- Storj price now – $0.28
- Storj market cap – $109.1 million
- Storj circulating supply – 387.4 million
- Storj total supply – 424.9 million
- Storj Coinmarketcap ranking – #177
STORJ/USD Market
Key Levels:
Resistance levels: $0.40, $0.45, $0.50
Support levels: $0.15, $0.10, $0.05

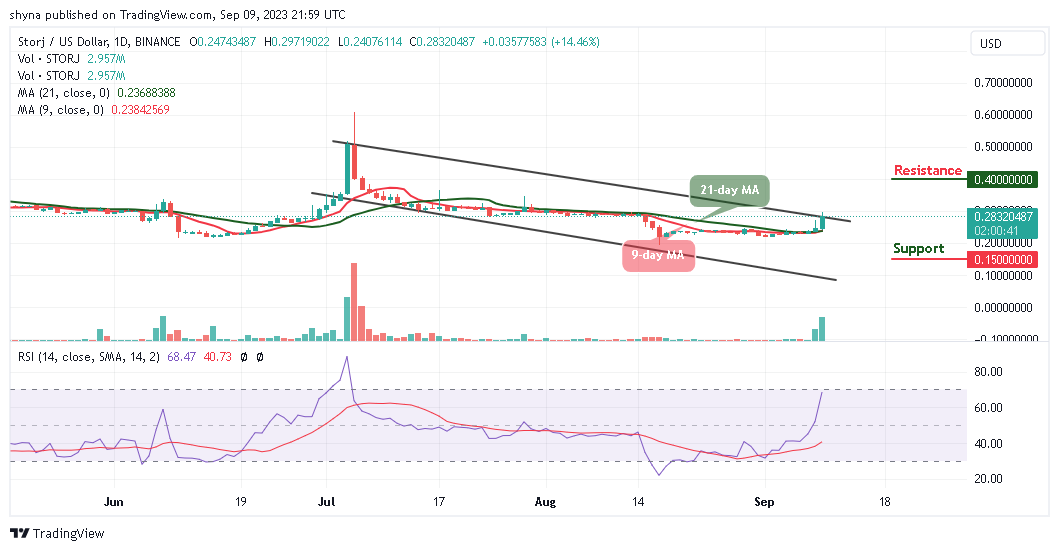
STORJ/USD hits the resistance level of $0.29 during the European session today, the coin is trading above the 9-day 21-day moving averages to cross above the upper boundary of the channel. However, if the Storj price breaks above this barrier, it could hit the nearest resistance level of $0.0.30. Meanwhile, the market price will have to cross above the channel to increase the buying pressure.
Storj Price Prediction: STORJ/USD Could Gain More
The Storj price is hovering above the 9-day and 21-day moving averages but any bearish movement below this barrier could bring the coin to the support levels of $0.15, $0.10, and $0.05. From above, a sustained movement above the upper boundary of the channel may create momentum for the bulls with the focus on moving the market to the next resistance levels of $0.40, $0.45, and $0.50.
Meanwhile, the technical indicator Relative Strength Index (14) signal line is likely to cross into the overbought region, which indicates that STORJ/USD may continue to trade bullishly. Meanwhile, the 9-day MA must cross above the 21-day MA for buyers to concentrate on stirring action to the north.
STORJ/BTC Looks for More Gains
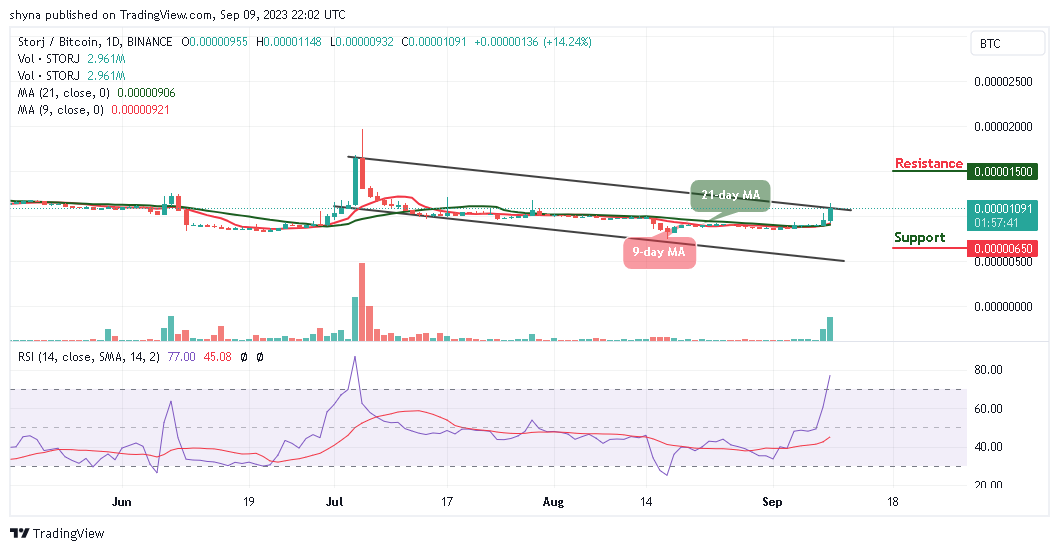
Against Bitcoin, looking at the chart for the past few days, traders can see that bulls have been showing a great commitment to STORJ trading as the coin continues to display positive signs. Furthermore, the current market trend may continue to go up if the buyers can sustain the pressure further.

However, if the bulls succeeded in pushing the coin above the upper boundary of the channel, the market price could hit the resistance level of 1500 SAT and above. On the contrary, a retest could allow the coin to go below the 9-day and 21-day moving averages and lower the price to the support level of 650 SAT and below. Nevertheless, the technical indicator Relative Strength Index (14) crosses into the overbought region, suggesting additional bullish signals into the market.
Storj Alternatives
As revealed by the daily chart, it is obvious that the Storj price may likely create more bullish trends once the coin crosses above the upper boundary of the channel, and this is noticeable for the technical indicator Relative Strength Index (14) as the signal line moves into the overbought region.
Nonetheless, concerning $WSM, there are no team tokens to be had. Wall Street Memes maintains an impressively robust and thriving community, making it advisable to secure the token without delay, rather than waiting. The presale’s outstanding success is a testament to the faith investors have already placed in $WSM, faith that is on the verge of being generously rewarded, with over $25 million collected to date.
Prepare now for $WSM massive revolution. Massive profits await investors!
New OKX Listing - Wall Street Memes
- Established Community of Stocks & Crypto Traders
- Featured on Cointelegraph, CoinMarketCap, Yahoo Finance
- Rated Best Crypto to Buy Now In Meme Coin Sector
- Team Behind OpenSea NFT Collection - Wall St Bulls
- Tweets Replied to by Elon Musk
Join Our Telegram channel to stay up to date on breaking news coverage


