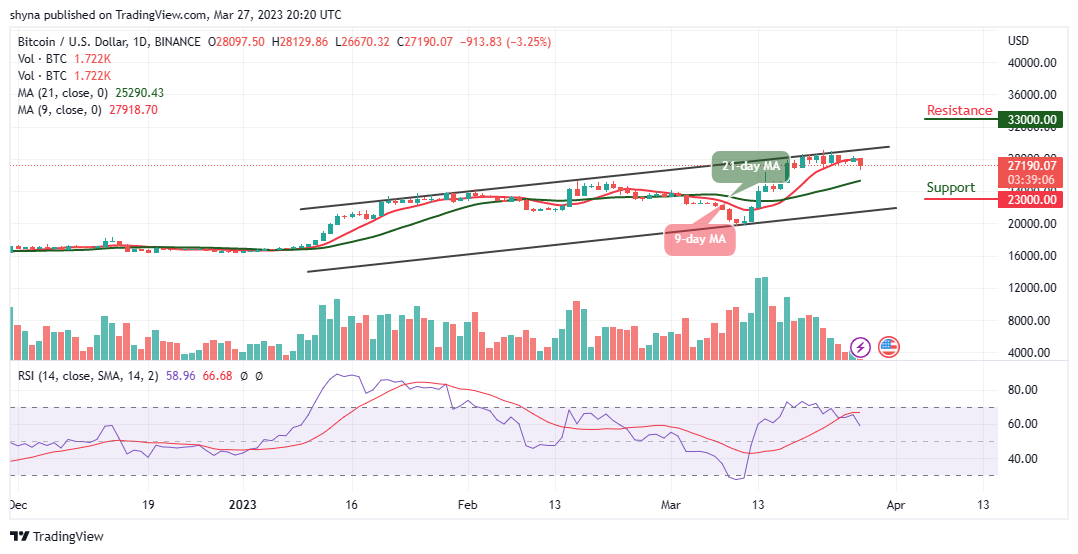
The Bitcoin price prediction shows that BTC may continue to fall if the price slide below the 21-day moving average.
Bitcoin Prediction Statistics Data:
- Bitcoin price now – $27,190
- Bitcoin market cap – $522.5 billion
- Bitcoin circulating supply – 19.3 million
- Bitcoin total supply – 19.3 million
- Bitcoin Coinmarketcap ranking – #1
BTC/USD Long-term Trend: Ranging (Daily Chart)
Key levels:
Resistance Levels: $33,000, $35,000, $37,000
Support Levels: $23,000, $21,000, $19,000
BTC/USD begins the day with the opening price of $28,097 but after touching the daily high of $28,129, the king coin begins to bleed as the market price crosses below the support level of $27,000 to hit the daily low at $26,670.
Bitcoin Price Prediction: Will Bitcoin Price Drop More?
Looking at the daily chart, the Bitcoin price is likely to break below the 21-day moving average, which could increase the selling pressure. At the time of writing, BTC/USD is hovering at $27,190 and if this is cleared, the dips to $26,500 are likely to be bought.
Moreover, if the price slides below the support level of $26k, another support of $25,000 may likely come into focus while the critical supports could be found at $23,000, $21,000, and $19,000. However, any bullish cross above the upper boundary of the channel could hit the first resistance at $28,500. Once this is done, $29,000 may come likely play out as any further bullish movement may hit the potential resistance levels at $33,000, $35,000, and $37,000 as the Relative Strength Index (14) moves to cross below the 60-level.
BTC/USD Medium-term Trend: Ranging (4H Chart)
The 4-hour chart shows that the Bitcoin bears are still dragging the coin to the downside. Although BTC/USD is hovering below the 9-day and 21-day moving averages as it has not yet slipped below $26,000 it’s still in the loop of making a bounce back.
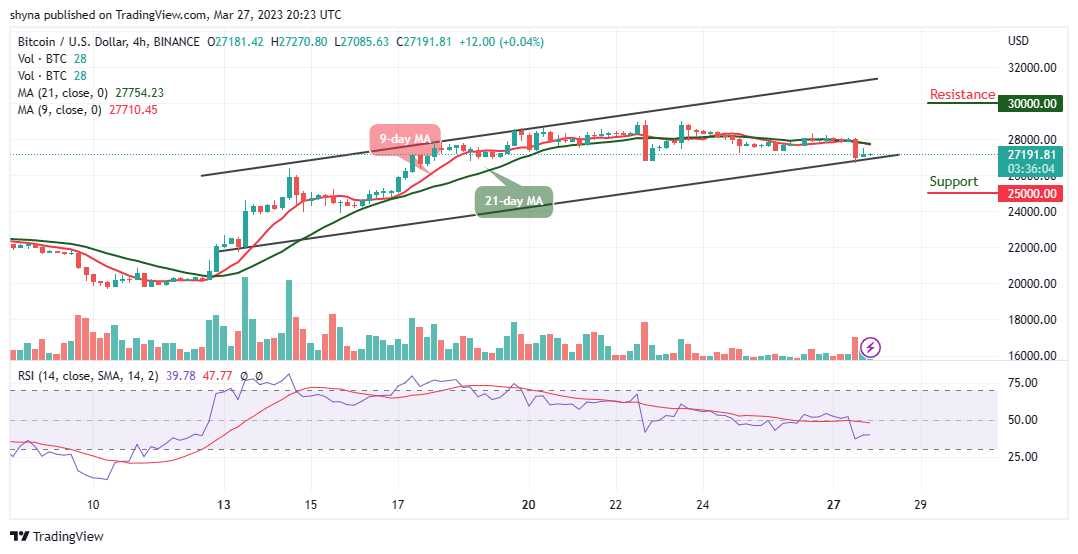
Meanwhile, the Bitcoin price may continue to hover below the moving averages, but the bullish movement could push the price to the resistance of $30,000 and above while the immediate support lies at $25,000 and below. The Relative Strength Index (14) is moving in the same direction below the 40-level, suggesting sideways movement in the market.
Alternatives to Bitcoin
Looking at the daily chart, the Bitcoin price is struggling to stay above $28,000 as the king coin declines heavily and more may still come if there is a close below the 21-day moving average. Nevertheless, a better new token called Love Hate Inu (LHINU) has achieved almost $2m in the presale. However, Love Hate Inu ensures you have the chance to voice your opinion and find a supportive community.