Join Our Telegram channel to stay up to date on breaking news coverage
Cardano remains under sellers’ pressure
ADA Price Analysis – October 01
When the buyers defend the support level of $0.42, the bulls’ pressure may push the price to break up $0.46, in which the next resistance levels can be found at $0.46, $0.48 and $0.54 levels. Should the bears exert more pressure, the daily candle may close below $0.42 level, Cardano may decrease to $0.38 and $0.34 levels
ADA/USD Market
Key Levels:
Resistance levels: $0.46, $0.48, $0.54
Support levels: $0.42, $0.38, $0.34
ADA/USD Long-term Trend: Bearish
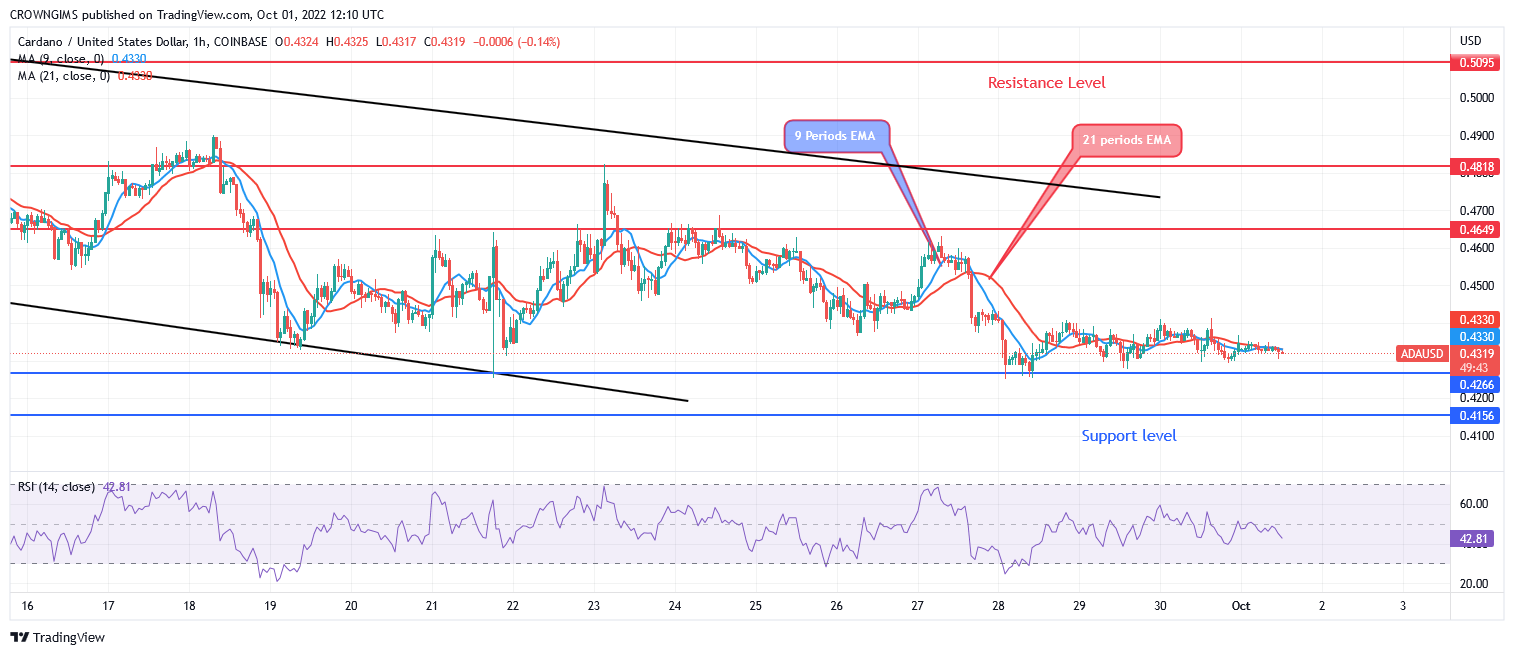
Cardano is bearish on the daily chart. The sellers hold unto the coin. The support level of $0.42 holds the price. A descending channel is formed by the price action. The price tested the upper trend line of the channel and drops to the lower trend line of the channel. More bearish candles are produced and the price is currently testing the support level of $42. This is the third time it will be testing the just mentioned level.
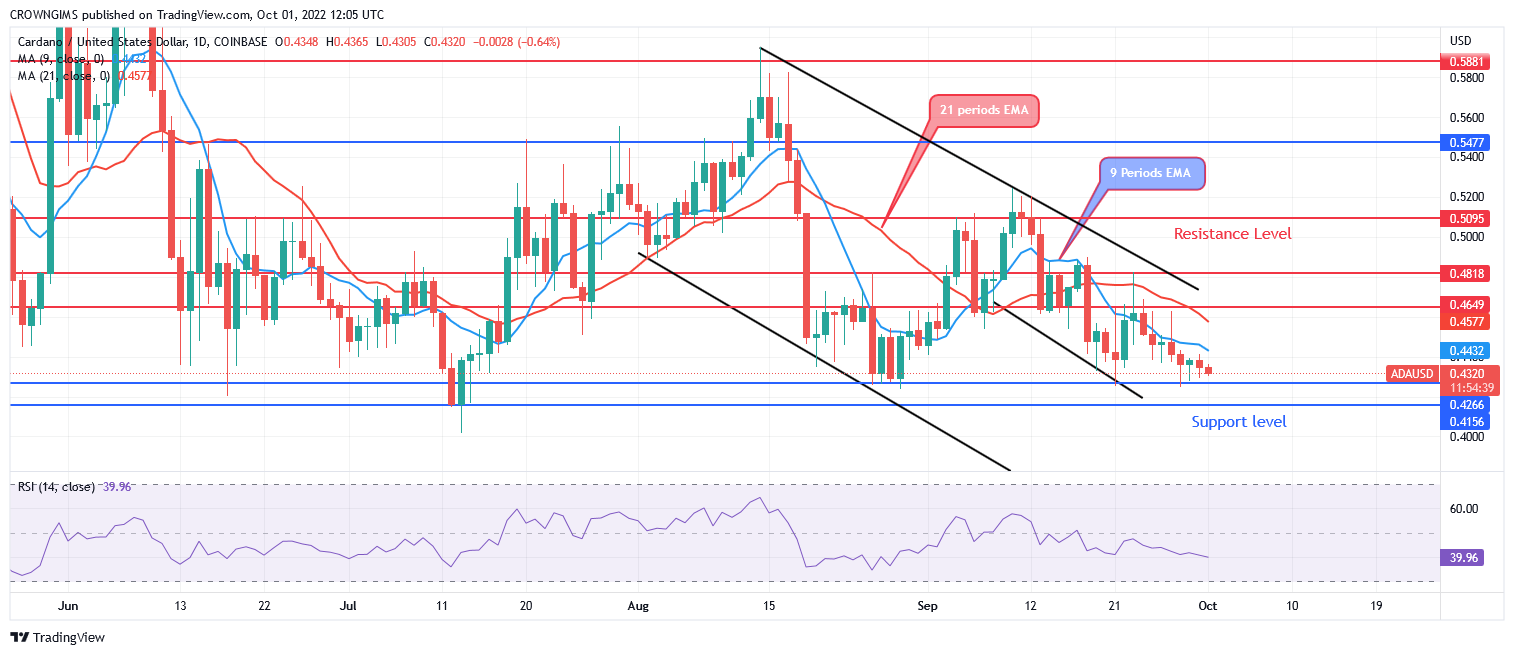
Cardano is trading below the two dynamic support levels of 9 periods EMA and 21 periods EMA at close which connote a bearish movement. When the buyers defend the support level of $0.42, the bulls’ pressure may push the price to break up $0.46, in which the next resistance levels can be found at $0.46, $0.48 and $0.54 levels. Should the bears exert more pressure, the daily candle may close below $0.42 level, Cardano may decrease to $0.38 and $0.34 levels. The technical indicator Relative Strength Index is at 39 levels with the signal line pointing downside which indicates a sell signal.
Your capital is at risk
ADA/USD Medium-term Trend: Bearish
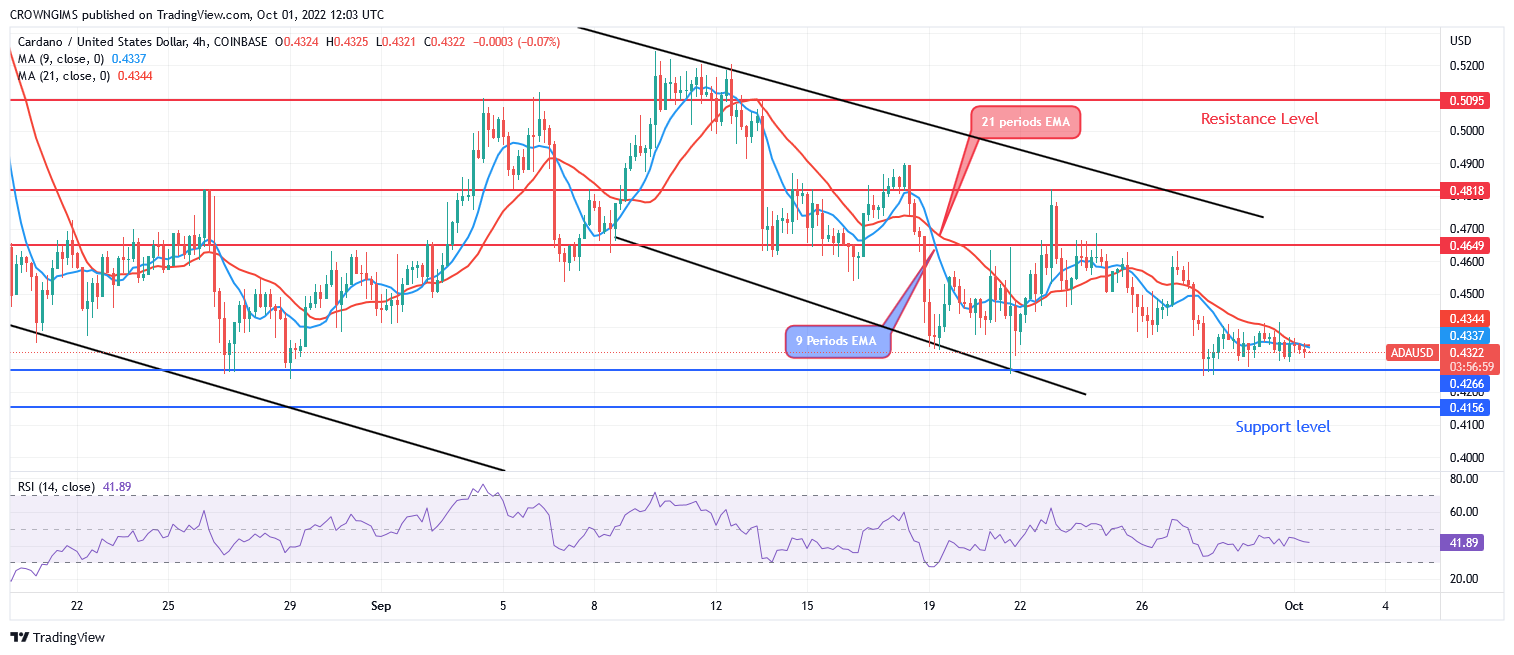
On 4-hour chart, Cardano is bearish. The bulls’ pressure could not break up the upper trend line of the descending channel formed on 4-hour time frame. The crypto is currently testing the support level of $0.42 and it is consolidating around the just mentioned level. Strong bears’ pressure on the 4-hour chart may reduce the price below $0.42 support level.
The 9 periods EMA is crossing the 21 periods EMA downside to indicate that bears are in control of Cardano market. The relative strength index period 14 is pointing downside at 41 levels indicating sell signal.
Join Our Telegram channel to stay up to date on breaking news coverage
