Join Our Telegram channel to stay up to date on breaking news coverage
Bitcoin Price Prediction – July 26
Currently, the BTC/USD market operation moves in corrections following the crypto’s inability to surge higher sustainably out of the $25,000 resistance line. Yesterday’s session witnessed a high and a low between the $22,649.22 and $21,361.64 points. As of writing, the price trades around $21,084 at a negative percentage of 1.12.
Bitcoin (BTC) Statistics:
BTC price now – $221,086.84
BTC market cap – $402.7 billion
BTC circulating supply – 19.1 million
BTC total supply – 19.1 million
Coinmarketcap ranking – #1
BTC/USD Market
Key Levels:
Resistance levels: $22,500, $25,000, $27,500
Support levels: $20,000, $17,500, $15,000 BTC/USD – Daily Chart
The daily chart reveals the crypto-economic market moves in corrections after hitting a resistance point close below the $25,000 level. The 14-day SMA indicator is at $21,823 below the 50-day SMA indicator. The horizontal line remains drawn at the psychological $20,000 support level. The Stochastic Oscillators have crossed southbound toward the 40 range. Yet, they are still pointing in a downward direction to indicate that a declining motion is ongoing.
Will the BTC/USD market run sustainably below the $20,000 critical support level?
Indications are suggesting the BTC/USD market operation may, in the long run, run into a declining motion past the $20,000 psychological level as observed that the crypto trade already moves in corrections after failing to surge through some overhead resistances. At this point, long-position placers needed to put the execution of buying orders on hold for a while until a formation occurs to signify a clear signal toward getting a decent entry.
On the downside of the technical analysis, selling pressure has dominated the trading arena of the BTC/USD despite the force backing it being relatively low. The $22,500 resistance level still happens to be the major-trading area that the price may find hard to breach while the market attempts to shoot up into a bullish trend. It won’t sound technically ideal if the trade spikes at that trading spot and sellers still go to launch an order without letting the situation gets a rejection in the process.
BTC/USD 4-hour Chart
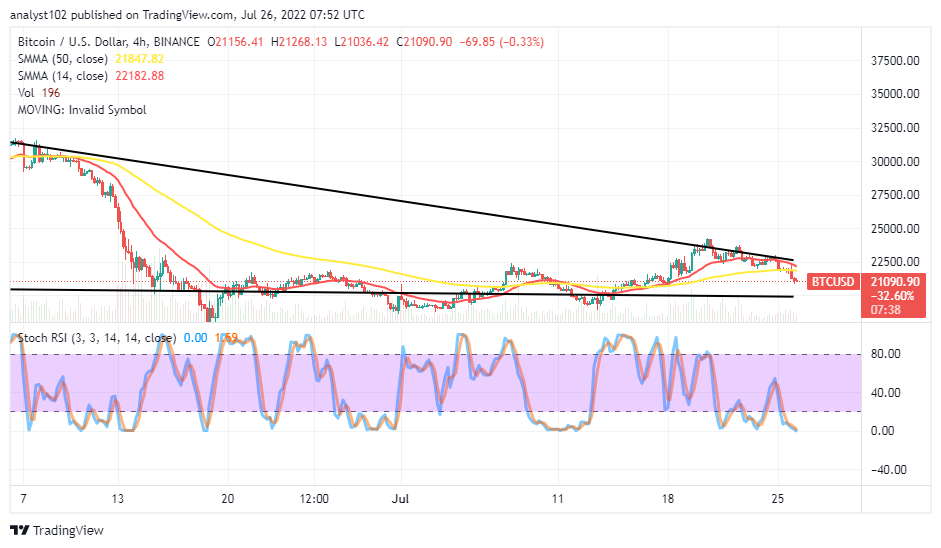
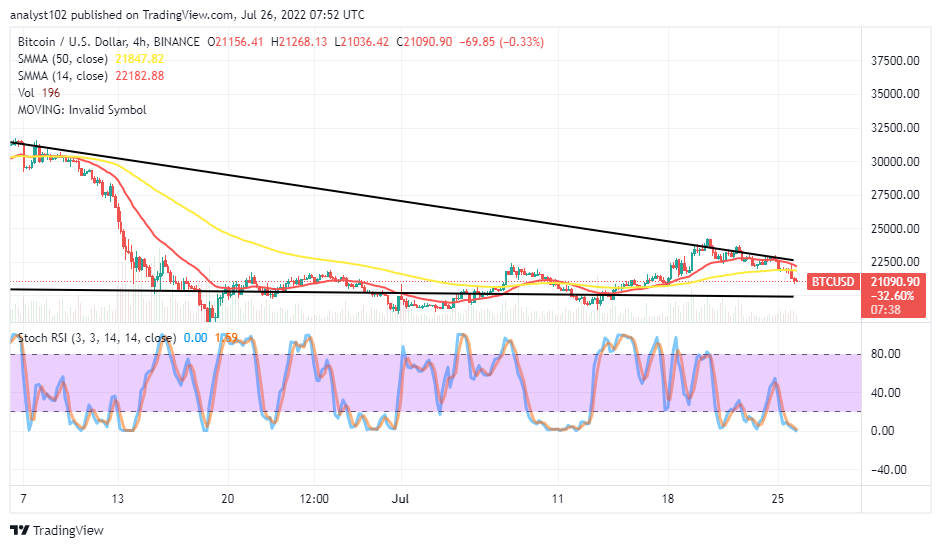
The BTC/USD medium-term chart showcases the crypto market moves in corrections, following a path over the trend lines of the SMAs. The 14-day SMA indicator is bent briefly over the 50-day SMA indicator. The smaller SMA’s positional point is at $22,182, while the bigger SMA’s is at $21,847. The Stochastic Oscillators are in the oversold region, trying to find a base within it. If the presence of the indicator in the lowest region turns into a consolidation manner, the crypto will risk the risk of further debasing through variant support points.
Read more:
Join Our Telegram channel to stay up to date on breaking news coverage


