Join Our Telegram channel to stay up to date on breaking news coverage
LTC Price Prediction – December 7
The Litecoin (LTC) price records gain of almost 0.88%, as the coin is seen approaching the $90 level.
LTC/USD Market
Key Levels:
Resistance levels: $100, $105, $110
Support levels: $70, $65, $60
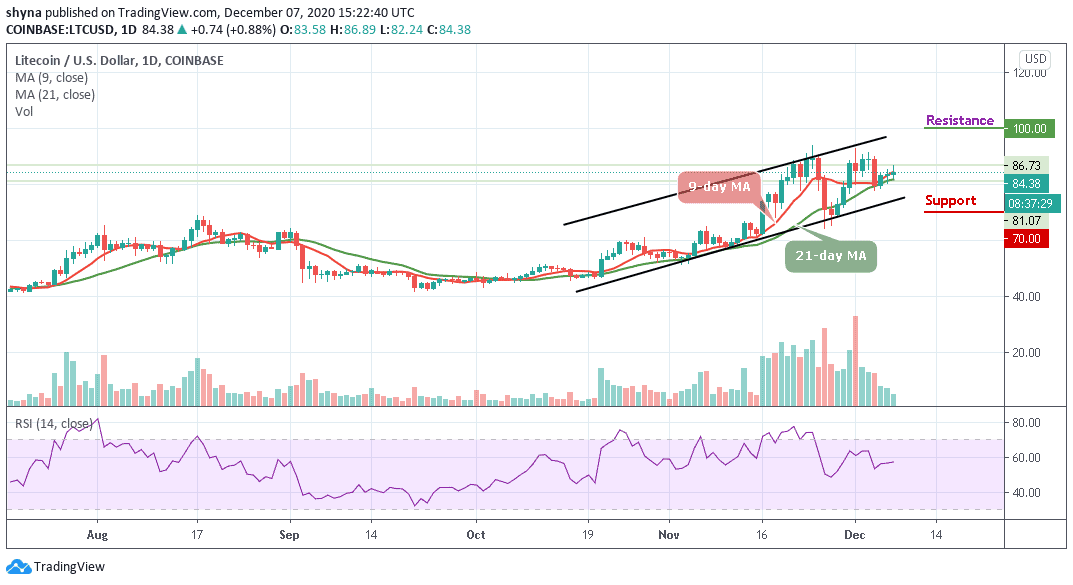
LTC/USD is trading in the green in today’s session, trading above the 21-day moving average with a gain of 0.88%. According to the daily chart, the candles formations are respecting the diagonal trend line (the lower boundary of the channel). Crossing down the channel might position price in a decline. Meanwhile, the closest support level is $72 and a north wave might see a high of $90 and beyond.
What to Except from Litecoin
As we can see, LTC/USD is recovering back above the 9-day moving average and towards the previous resistance of $86. An increase above this initial resistance could trigger intense buying to $100, $105, and $110 resistance levels. In other words, looking at the downside, the Litecoin price may likely hold support level at $82.24 which is the current daily low. Therefore, if the Litecoin price drops below this support level, it may likely hit the closest support at $80.
Meanwhile, the next support after this is located at $70 where it may even dip to $65 and $60 supports if the selling volume keeps increasing. Nevertheless, the technical indicator RSI (14) reveals that the market may likely follow the sideways movement if the signal line keeps moving in the same direction below the 60-level.
Comparing with Bitcoin, the buyers are making an attempt to step back into the market as the coin is trying to move above the 9-day and 21-day moving averages. Meanwhile, from the upside, the nearest level of resistance lies at 4600 SAT and above this, higher resistance lies at 4800 SAT and 5000 SAT. A lot of people resort to trading with algo tools such as the Bitcoin Prime for maximum success.
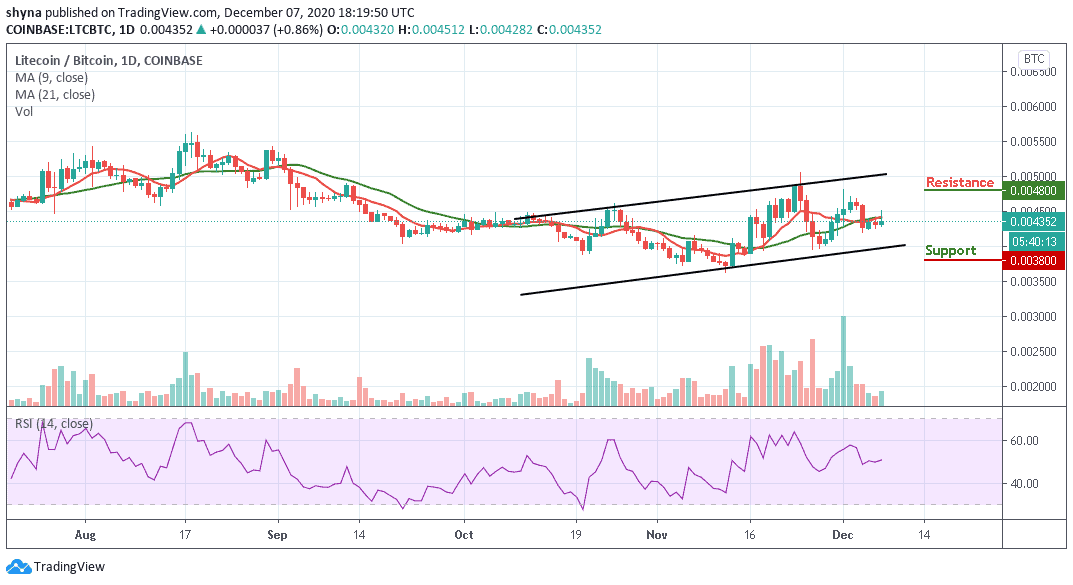
Looking at the downside; the nearest level of support is 4200 SAT and beneath this, further support lies at 4000 SAT. If the price drops further to create a new low, lower support is therefore located at 3800 SAT and 3600 SAT respectively. The RSI (14) is moving around the 50-level which shows that the bulls may come into focus.
Join Our Telegram channel to stay up to date on breaking news coverage