Join Our Telegram channel to stay up to date on breaking news coverage
Bitcoin (BTC) Price Prediction – September 25
The Bitcoin price is currently consolidating within the channel and seems to be preparing for the next move.
BTC/USD Long-term Trend: Ranging(Daily Chart)
Key levels:
Resistance Levels: $11,400, $11,600, $11,800
Support Levels: $10,000, $9,800, $9,600
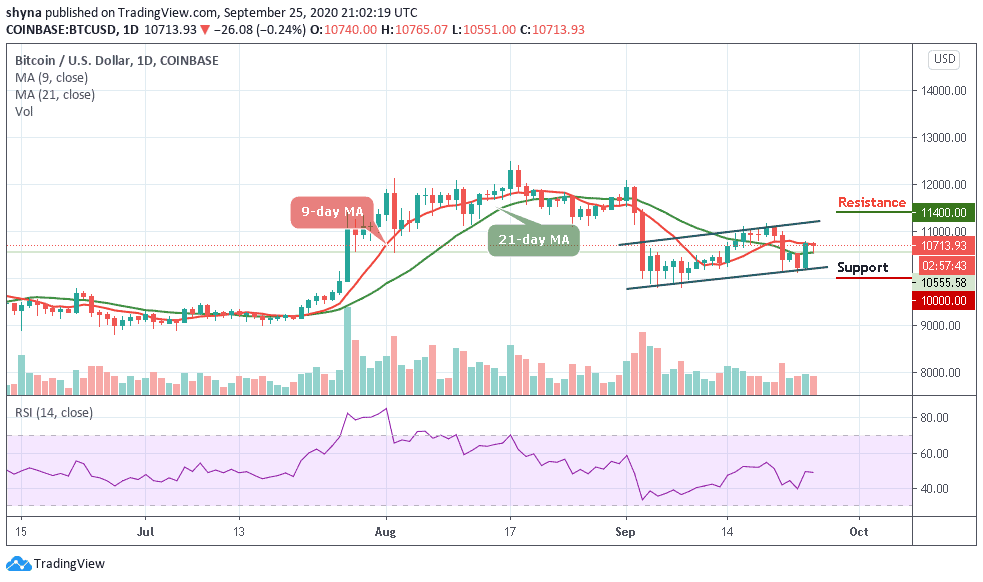
After a tremendous bullish movement of yesterday’s trading, BTC/USD settles below the $10,765 support level and below the 9-day and 21-day moving averages. Today, the price is consolidating losses above the $10,700 level but currently trading at $10,713.93.
Where is BTC Price Going Next?
On the upside, if there is upsides break above $10,800 and $11,000, the Bitcoin price may recover towards the $11,200 and $11,300 level. However, the main resistance for the bulls is near the $11,400, $11,600, and $10,800 levels. Conversely, there could be more losses if there is no break above the moving averages. Meanwhile, the main supports on the downside near $10,400 and $10,300.
However, if there is a downside break below $10,100, the price may accelerate decline towards the $10,000, $9,800, and $9,600 support levels. Meanwhile, the RSI (14) for BTC/USD is currently moving in the same direction around 49-level waiting for the next move.
BTC/USD Medium-Term Trend: Bullish (4H Chart)
Looking technically, BTC/USD is hovering at $10,736, and above the 9-day and 21-day moving averages to mitigate the short-term bearish pressure and allow for an extended recovery towards $11,000. This psychological barrier is closely followed by $11,100 and $11,300 resistance levels.
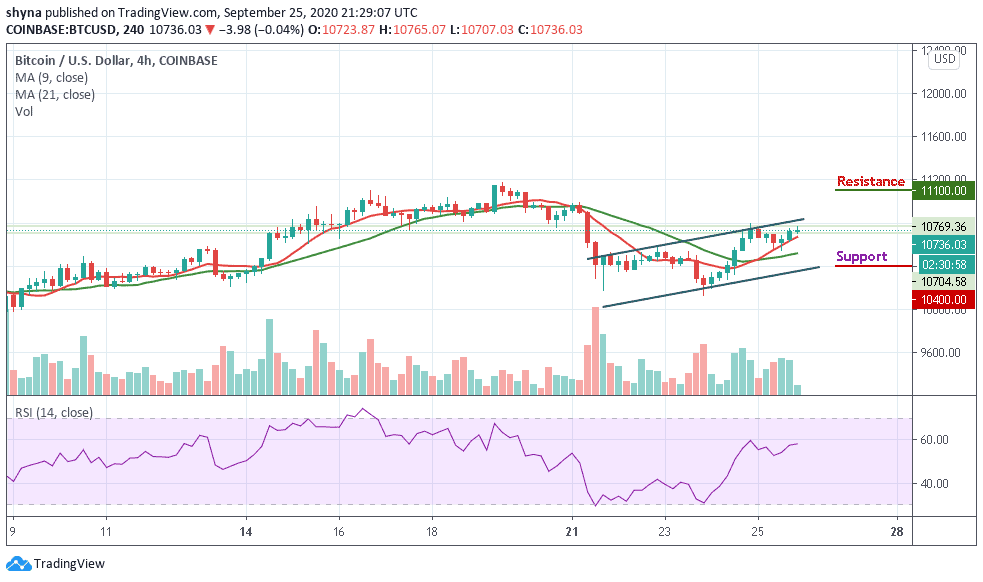
In contrast, the nearest support is at $10,600, and a sustainable move below the moving averages could increase the downside pressure and push the price towards $10,400 and $10,200 support levels. Considering that the RSI (14) on a 4-hour chart is starting to revert to the upside, traders might expect that the bull’s case scenario may play out.
Join Our Telegram channel to stay up to date on breaking news coverage